Permanent Magnets Market, by Material (Neodymium Iron Boron, Ferrite, Samarium Cobalt, and Aluminium Nickel Cobalt), By Application (Consumer Electronics, Industrial, Automotive, Medical, Energy, and Aerospace & Defence)and Geography (NA, EU, APAC, LATAM, and MEA) Analysis, Share, Trends, Size, & Forecast from 2019 2025

|
Report ID
AV456
|
Published Date
December 2020
|
Pages
188
|
Industry
Semiconductor and Electronics
|
|
|
Base Year
2025
|
Historical Data
2019-2024
|
Delivery Timeline
24 Hour
|
REPORT HIGHLIGHT
Permanent Magnets Market was valued at USD 18.97 billion by 2018, growing with 9.3% CAGR during the forecast period, 2019-2025.
Market Dynamics
The market for permanent magnets is witnessing a steady rise over the past few years. This industry is expected to continue to boom owing to the application of permanent magnet in the automotive industry. Based on information published in the India Brand Equity Foundation website (September 2019), the automotive industry growth year or year for FY 2019 grew by 17% for commercial vehicle. With a consistent rise in the need for magnets in the automotive industry, the growth of the automotive sector is, therefore, a key driver.
Robotics is another lucrative industry that needs permanent magnets in the core functioning of the motor. Given the rise in technology, the rise in demand for service robots will automatically improve the demand for these permanent magnets over the forecasted period. The use of these magnets in the energy generation makes may be the reason for its steady demand over the forecasted period. Since these are great alternatives for induction generators due to its design, lightweight capacity, low noise and easy maintenance, the demand for this product will continue to surge. One of the market restraints is the fragmented market scenario that permanent magnets face. The demand for these magnets has resulted in many Chinese companies producing these in a small case, thus affecting the price and demand.
Material Takeaway
The core categorizations that can be used to segment the permanent magnets market are Aluminum Nickel Cobalt (Alnico), Ferrite (NdFeB), Neodymium Iron Boron, and Samarium Cobalt (SmCo). Of which, ferrite remains the most commonly used raw material for the production of permanent magnets. This is due to the large application of ferrite based magnets in an automotive application. Ferrite being used as a raw material spearheads this industry by capturing as much as 80% of all permanent magnets manufactured.
One of the primary reasons why permanent magnets using ferrite continues to lead is because of the low cost of the product and also the fact that it is very easily available. Following which, Neodymium Iron Boron is used in applications such as speakers and electric cycles etc. Due to a rise in electric cycles and hybrid cars, the market for permanent magnets using Neodymium Iron Boron is forecasted to be fast-growing. Aluminium Nickel Cobalt is commonly used in sensors and loudspeakers.
Application takeaway
Application wise the use of permanent magnets can be classified into industrial, consumer electronics, medical technology, automotive, environment & energy, aerospace & defense, and others. The automotive sector has dominated the application category and is anticipated to continue to dominate in the future as well. Newer advances in technology such as the rise in need for electric cycles and hybrid cars will continue to increase the demand for this product significantly. In terms of the fastest-growing category, the consumer electronics market is expected to grow at speed.
 Regional Takeaway
The Asia Pacific region, especially areas like India and China continue to grow at a fast pace . Most of the manufacturers of electric cars components are in China, due to which the demand here is higher. In addition, the growth in industrialization and the fact that these will continue to be the major manufacturing Hub is why the Asia Pacific is witnessing a consistent growth. Based on the growing need for the consumer electronics market, North America is expected to the fastest growing industry in the coming years. The European market is also likely to grow since this is the base of the aerospace and defense sector.
Key Vendor Takeaway
The key players that dominate this market are Adams Magnetic Products Co., Anhui Earth-Panda Advance Magnetic Material Co. Ltd, Hitachi Metals Ltd, Hangzhou Permanent Magnet Group, Shin-Etsu Chemical, and Molycorp Magnequench among some other companies. Adams Magnetic Products & co. have launched two additional production lines in Elmhurst and Carlsbad respectively. These lines will produce flexible magnetic fabrication, to meet the growing demand for flexible magnetic strips.
The market size and forecast for each segment and sub-segments has been considered as below:
- Historical Year – 2014 & 2016
- Base Year – 2018
- Estimated Year – 2019
- Projected Year – 2025
TARGET AUDIENCE
- Traders, Distributors, and Suppliers
- Manufacturers
- Government and Regional Agencies
- Research Organizations
- Consultants
- Distributors
SCOPE OF THE REPORT
The scope of this report covers the market by its major segments, which include as follows:
KEY PLAYERS
- Adams Magnetic Products Co.
- Anhui Earth-Panda Advance Magnetic Material Co. Ltd
- TDK Corporation
- Thomas & Skinner, Inc.
- Pacific Metals Co., Ltd.
- Electron Energy Corporation
- SsangYong Materials Corp.
- Magnequench International, LLC
- Hitachi Metals Ltd
- Hangzhou Permanent Magnet Group
- Shin-Etsu Chemical
- Molycorp Magnequench
MARKET, BY MATERIALS
- Ferrite
- Neodymium Iron Boron (NdFeB)
- Samarium Cobalt (SmCo)
- Aluminum Nickel Cobalt (Alnico)
MARKET, BY END-USE
- Consumer Electronics
- General Industrial
- Automotive
- Medical Technology
- Environment & Energy
- Aerospace & Defense
- Others
MARKET, BY REGION
- North America
- U.S.
- Canada
- Europe
- Germany
- France
- Italy
- Spain
- United Kingdom
- Rest of Europe
- Asia Pacific
- India
- China
- South Korea
- Japan
- Singapore
- Rest of APAC
- Latin America
- Brazil
- Mexico
- Argentina
- Rest of LATAM
- Middle East and Africa
- Saudi Arabia
- United Arab Emirates
- Rest of MEA
TABLE OF CONTENT
1.PERMANENT MAGNETS MARKET OVERVIEW
1.1.Study Scope
1.2.Assumption and Methodology
2.EXECUTIVE SUMMARY
2.1.Market Snippet
2.1.1.Market Snippet by Material
2.1.2.Market Snippet by End-Use
2.1.3.Market Snippet by Region
2.2.Competitive Insights
3.PERMANENT MAGNETS KEY MARKET TRENDS
3.1.Market Drivers
3.1.1.Impact Analysis of Market Drivers
3.2.Market Restraints
3.2.1.Impact Analysis of Market Restraints
3.3.Market Opportunities
3.4.Market Future Trends
4.PERMANENT MAGNETS INDUSTRY STUDY
4.1.Porter’s Five Forces Analysis
4.2.Marketing Strategy Analysis
4.3.Growth Prospect Mapping
4.4.Regulatory Framework Analysis
5.PERMANENT MAGNETS MARKET LANDSCAPE
5.1.Market Share Analysis
5.2.Key Innovators
5.3.Breakdown Data, by Key manufacturer
5.3.1.Established Player Analysis
5.3.2.Emerging Player Analysis
6.PERMANENT MAGNETS MARKET – BY MATERIAL
6.1.Overview
6.1.1.Segment Share Analysis, By Material, 2018 & 2025 (%)
6.2.Ferrite
6.2.1.Overview
6.2.2.Market Analysis, Forecast, and Y-O-Y Growth Rate, 2014 – 2025, (US$ Million)
6.3.Neodymium Iron Boron (NdFeB)
6.3.1.Overview
6.3.2.Market Analysis, Forecast, and Y-O-Y Growth Rate, 2014 – 2025, (US$ Million)
6.4.Samarium Cobalt (SmCo)
6.4.1.Overview
6.4.2.Market Analysis, Forecast, and Y-O-Y Growth Rate, 2014 – 2025, (US$ Million)
6.5.Aluminum Nickel Cobalt (Alnico)
6.5.1.Overview
6.5.2.Market Analysis, Forecast, and Y-O-Y Growth Rate, 2014 – 2025, (US$ Million)
7.PERMANENT MAGNETS MARKET – BY END USE
7.1.Overview
7.1.1.Segment Share Analysis, By End Use, 2018 & 2025 (%)
7.2.Consumer Electronics
7.2.1.Overview
7.2.2.Market Analysis, Forecast, and Y-O-Y Growth Rate, 2014 – 2025, (US$ Million)
7.3.General Industrial
7.3.1.Overview
7.3.2.Market Analysis, Forecast, and Y-O-Y Growth Rate, 2014 – 2025, (US$ Million)
7.4.Automotive
7.4.1.Overview
7.4.2.Market Analysis, Forecast, and Y-O-Y Growth Rate, 2014 – 2025, (US$ Million)
7.5.Medical Technology
7.5.1.Overview
7.5.2.Market Analysis, Forecast, and Y-O-Y Growth Rate, 2014 – 2025, (US$ Million)
7.6.Environment & Energy
7.6.1.Overview
7.6.2.Market Analysis, Forecast, and Y-O-Y Growth Rate, 2014 – 2025, (US$ Million)
7.7.Aerospace & Defense
7.7.1.Overview
7.7.2.Market Analysis, Forecast, and Y-O-Y Growth Rate, 2014 – 2025, (US$ Million)
7.8.Others
7.8.1.Overview
7.8.2.Market Analysis, Forecast, and Y-O-Y Growth Rate, 2014 – 2025, (US$ Million)
8.PERMANENT MAGNETS MARKET– BY GEOGRAPHY
8.1.Introduction
8.1.1.Segment Share Analysis, By Region, 2018 & 2025 (%)
8.2.North America
8.2.1.Overview
8.2.2.Key Manufacturers in North America
8.2.3.North America Market Size and Forecast, By Country, 2014 – 2025 (US$ Million)
8.2.4.North America Market Size and Forecast, By Material, 2014 – 2025 (US$ Million)
8.2.5.North America Market Size and Forecast, By End-Use, 2014 – 2025 (US$ Million)
8.2.6.U.S.
8.2.6.1.Overview
8.2.6.2.Market Analysis, Forecast, and Y-O-Y Growth Rate, 2014 – 2025, (US$ Million)
8.2.7.Canada
8.2.7.1.Overview
8.2.7.2.Market Analysis, Forecast, and Y-O-Y Growth Rate, 2014 – 2025, (US$ Million)
8.3.Europe
8.3.1.Overview
8.3.2.Key Manufacturers in Europe
8.3.3.Europe Market Size and Forecast, By Country, 2014 – 2025 (US$ Million)
8.3.4.Europe Market Size and Forecast, By Material, 2014 – 2025 (US$ Million)
8.3.5.Europe Market Size and Forecast, By End-Use, 2014 – 2025 (US$ Million)
8.3.6.Germany
8.3.6.1.Overview
8.3.6.2.Market Analysis, Forecast, and Y-O-Y Growth Rate, 2014 – 2025, (US$ Million)
8.3.7.Italy
8.3.7.1.Overview
8.3.7.2.Market Analysis, Forecast, and Y-O-Y Growth Rate, 2014 – 2025, (US$ Million)
8.3.8.United Kingdom
8.3.8.1.Overview
8.3.8.2.Market Analysis, Forecast, and Y-O-Y Growth Rate, 2014 – 2025, (US$ Million)
8.3.9.France
8.3.9.1.Overview
8.3.9.2.Market Analysis, Forecast, and Y-O-Y Growth Rate, 2014 – 2025, (US$ Million)
8.3.10.Rest of Europe
8.3.10.1.Overview
8.3.10.2.Market Analysis, Forecast, and Y-O-Y Growth Rate, 2014 – 2025, (US$ Million)
8.4.Asia Pacific (APAC)
8.4.1.Overview
8.4.2.Key Manufacturers in Asia Pacific
8.4.3.Asia Pacific Market Size and Forecast, By Country, 2014 – 2025 (US$ Million)
8.4.4.Asia Pacific Market Size and Forecast, By Material, 2014 – 2025 (US$ Million)
8.4.5.Asia Pacific Market Size and Forecast, By End-Use, 2014 – 2025 (US$ Million)
8.4.6.India
8.4.6.1.Overview
8.4.6.2.Market Analysis, Forecast, and Y-O-Y Growth Rate, 2014 – 2025, (US$ Million)
8.4.7.China
8.4.7.1.Overview
8.4.7.2.Market Analysis, Forecast, and Y-O-Y Growth Rate, 2014 – 2025, (US$ Million)
8.4.8.Japan
8.4.8.1.Overview
8.4.8.2.Market Analysis, Forecast, and Y-O-Y Growth Rate, 2014 – 2025, (US$ Million)
8.4.9.South Korea
8.4.9.1.Overview
8.4.9.2.Market Analysis, Forecast, and Y-O-Y Growth Rate, 2014 – 2025, (US$ Million)
8.4.10.Rest of APAC
8.4.10.1.Overview
8.4.10.2.Market Analysis, Forecast, and Y-O-Y Growth Rate, 2014 – 2025, (US$ Million)
8.5.Latin America
8.5.1.Overview
8.5.2.Key Manufacturers in Latin America
8.5.3.Latin America Market Size and Forecast, By Country, 2014 – 2025 (US$ Million)
8.5.4.Latin America Market Size and Forecast, By Material, 2014 – 2025 (US$ Million)
8.5.5.Latin America Market Size and Forecast, By End-Use, 2014 – 2025 (US$ Million)
8.5.6.Brazil
8.5.6.1.Overview
8.5.6.2.Market Analysis, Forecast, and Y-O-Y Growth Rate, 2014 – 2025, (US$ Million)
8.5.7.Mexico
8.5.7.1.Overview
8.5.7.2.Market Analysis, Forecast, and Y-O-Y Growth Rate, 2014 – 2025, (US$ Million)
8.5.8.Argentina
8.5.8.1.Overview
8.5.8.2.Market Analysis, Forecast, and Y-O-Y Growth Rate, 2014 – 2025, (US$ Million)
8.5.9.Rest of LATAM
8.5.9.1.Overview
8.5.9.2.Market Analysis, Forecast, and Y-O-Y Growth Rate, 2014 – 2025, (US$ Million)
8.6.Middle East and Africa
8.6.1.Overview
8.6.2.Key Manufacturers in Middle East and Africa
8.6.3.Middle East and Africa Market Size and Forecast, By Country, 2014 – 2025 (US$ Million)
8.6.4.Middle East and Africa Market Size and Forecast, By Material, 2014 – 2025 (US$ Million)
8.6.5.Middle East and Africa Market Size and Forecast, By End-Use, 2014 – 2025 (US$ Million)
8.6.6.Saudi Arabia
8.6.6.1.Overview
8.6.6.2.Market Analysis, Forecast, and Y-O-Y Growth Rate, 2014 – 2025, (US$ Million)
8.6.7.United Arab Emirates
8.6.7.1.Overview
8.6.7.2.Market Analysis, Forecast, and Y-O-Y Growth Rate, 2014 – 2025, (US$ Million)
9.KEY VENDOR ANALYSIS
9.1.Adams Magnetic Products Co.
9.1.1.Company Snapshot
9.1.2.Financial Performance
9.1.3.Product Benchmarking
9.1.4.Strategic Initiatives
9.2.TDK Corporation
9.3.Thomas & Skinner, Inc.
9.4.Pacific Metals Co., Ltd.
9.5.SsangYong Materials Corp.
9.6.Electron Energy Corporation
9.7.Anhui Earth-Panda Advance Magnetic Material Co. Ltd
9.8.Hitachi Metals Ltd
9.9.Hangzhou Permanent Magnet Group
9.10.Shin-Etsu Chemical
9.11.Molycorp Magnequench
10.360 DEGREE ANALYSTVIEW
11.APPENDIX
11.1.Research Methodology
11.2.References
11.3.Abbreviations
11.4.Disclaimer
11.5.Contact Us
List of Tables
TABLE List of data sources
TABLE Market drivers; Impact Analysis
TABLE Market restraints; Impact Analysis
TABLE Permanent Magnets market: Material snapshot (2018)
TABLE Segment Dashboard; Definition and Scope, by Material
TABLE Global Permanent Magnets market, by Material 2014-2025 (USD Million)
TABLE Permanent Magnets market: End-Use snapshot (2018)
TABLE Segment Dashboard; Definition and Scope, by End-Use
TABLE Global Permanent Magnets market, by End-Use 2014-2025 (USD Million)
TABLE Permanent Magnets market: Regional snapshot (2018)
TABLE Segment Dashboard; Definition and Scope, by Region
TABLE Global Permanent Magnets market, by Region 2014-2025 (USD Million)
TABLE North America Permanent Magnets market, by Country, 2014-2025 (USD Million)
TABLE North America Permanent Magnets market, by Material, 2014-2025 (USD Million)
TABLE North America Permanent Magnets market, by End-Use, 2014-2025 (USD Million)
TABLE Europe Permanent Magnets market, by country, 2014-2025 (USD Million)
TABLE Europe Permanent Magnets market, by Material, 2014-2025 (USD Million)
TABLE Europe Permanent Magnets market, by End-Use, 2014-2025 (USD Million)
TABLE Asia Pacific Permanent Magnets market, by country, 2014-2025 (USD Million)
TABLE Asia Pacific Permanent Magnets market, by Material, 2014-2025 (USD Million)
TABLE Asia Pacific Permanent Magnets market, by End-Use, 2014-2025 (USD Million)
TABLE Latin America Permanent Magnets market, by country, 2014-2025 (USD Million)
TABLE Latin America Permanent Magnets market, by Material, 2014-2025 (USD Million)
TABLE Latin America Permanent Magnets market, by End-Use, 2014-2025 (USD Million)
TABLE Middle East and Africa Permanent Magnets market, by country, 2014-2025 (USD Million)
TABLE Middle East and Africa Permanent Magnets market, by Material, 2014-2025 (USD Million)
TABLE Middle East and Africa Permanent Magnets market, by End-Use, 2014-2025 (USD Million)
List of Figures
FIGURE Permanent Magnets market segmentation
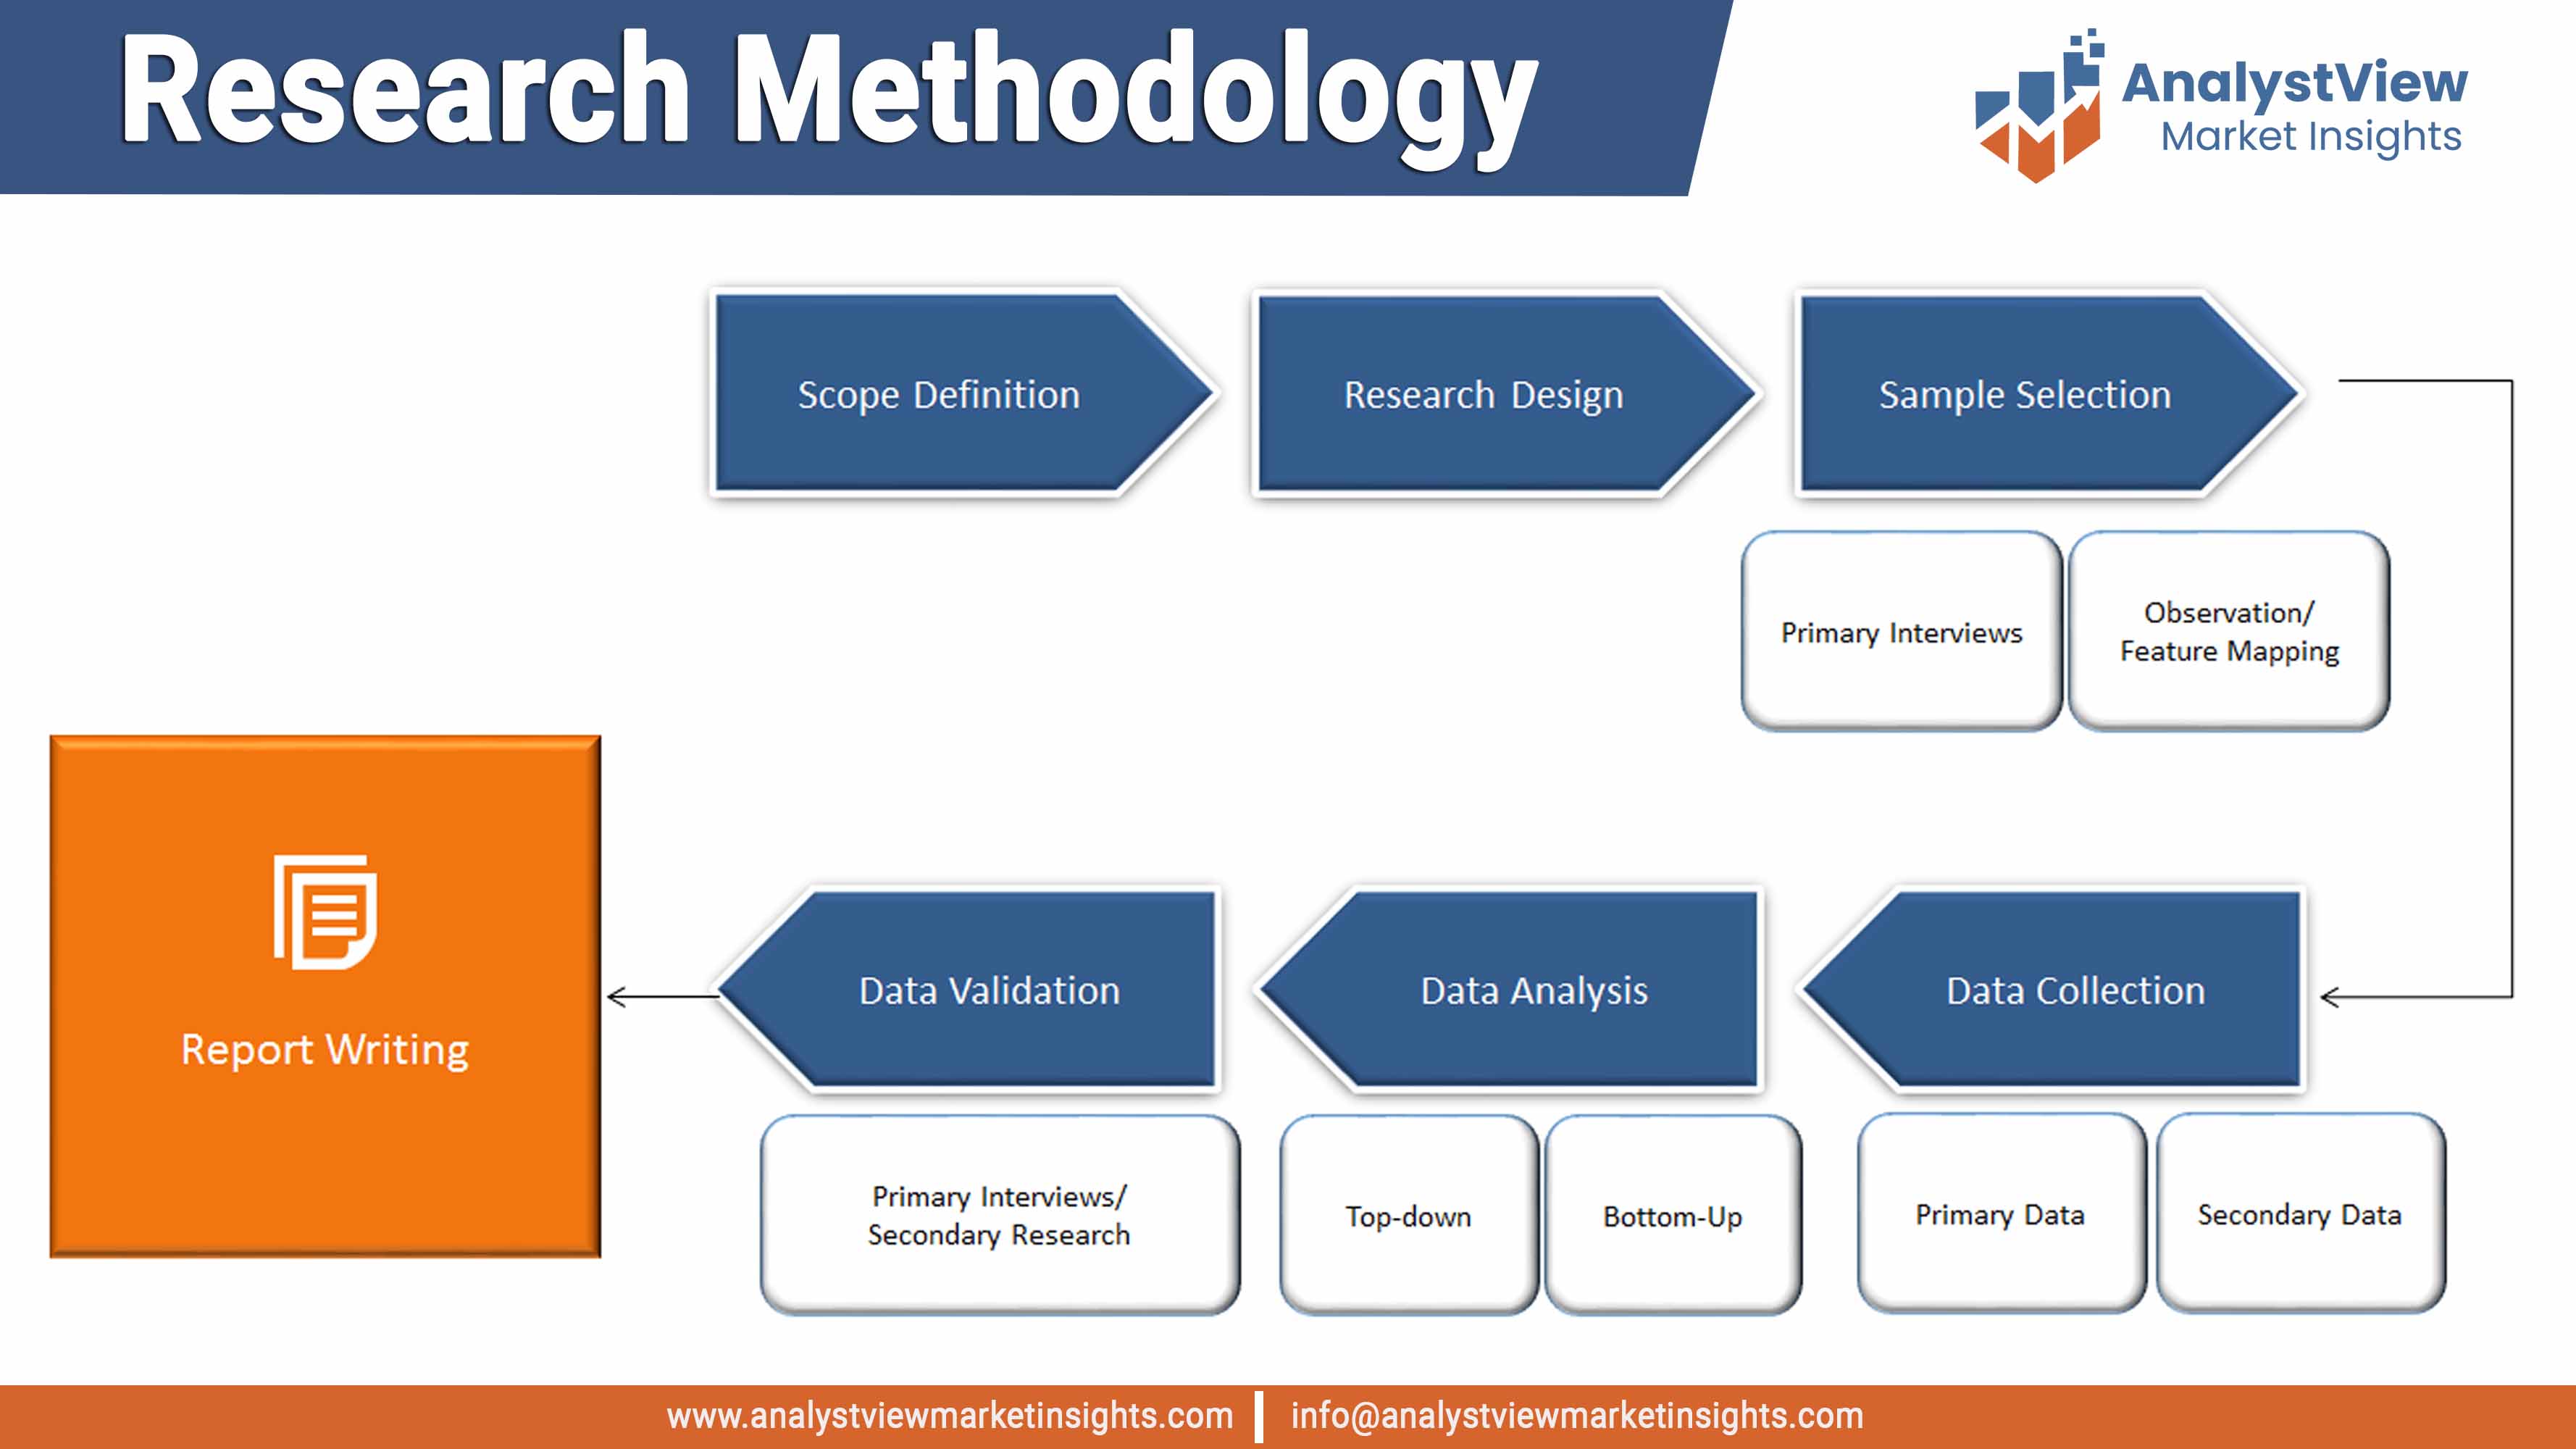
FIGURE Market research methodology
FIGURE Value chain analysis
FIGURE Porter’s Five Forces Analysis
FIGURE Market Attractiveness Analysis
FIGURE Competitive Landscape; Key company market share analysis, 2018
FIGURE Material segment market share analysis, 2018 & 2025
FIGURE Material segment market size forecast and trend analysis, 2014 to 2025 (USD Million)
FIGURE Ferrite market size forecast and trend analysis, 2014 to 2025 (USD Million)
FIGURE Neodymium Iron Boron (NdFeB) market size forecast and trend analysis, 2014 to 2025 (USD Million)
FIGURE Samarium Cobalt (SmCo) market size forecast and trend analysis, 2014 to 2025 (USD Million)
FIGURE Aluminum Nickel Cobalt (Alnico) market size forecast and trend analysis, 2014 to 2025 (USD Million)
FIGURE End-Use segment market share analysis, 2018 & 2025
FIGURE End-Use segment market size forecast and trend analysis, 2014 to 2025 (USD Million)
FIGURE Consumer Electronics market size forecast and trend analysis, 2014 to 2025 (USD Million)
FIGURE General Industrial market size forecast and trend analysis, 2014 to 2025 (USD Million)
FIGURE Automotive market size forecast and trend analysis, 2014 to 2025 (USD Million)
FIGURE Medical Technology market size forecast and trend analysis, 2014 to 2025 (USD Million)
FIGURE Environment & Energy market size forecast and trend analysis, 2014 to 2025 (USD Million)
FIGURE Aerospace & Defense market size forecast and trend analysis, 2014 to 2025 (USD Million)
FIGURE Others market size forecast and trend analysis, 2014 to 2025 (USD Million)
FIGURE Regional segment market share analysis, 2018 & 2025
FIGURE Regional segment market size forecast and trend analysis, 2014 to 2025 (USD Million)
FIGURE North America Permanent Magnets market share and leading players, 2018
FIGURE Europe Permanent Magnets market share and leading players, 2018
FIGURE Asia Pacific Permanent Magnets market share and leading players, 2018
FIGURE Latin America Permanent Magnets market share and leading players, 2018
FIGURE Middle East and Africa Permanent Magnets market share and leading players, 2018
FIGURE North America Permanent Magnets market share analysis by country, 2018
FIGURE U.S. Permanent Magnets market size, forecast and trend analysis, 2014 to 2025 (USD Million)
FIGURE Canada Permanent Magnets market size, forecast and trend analysis, 2014 to 2025 (USD Million)
FIGURE Europe Permanent Magnets market share analysis by country, 2018
FIGURE Germany Permanent Magnets market size, forecast and trend analysis, 2014 to 2025 (USD Million)
FIGURE Spain Permanent Magnets market size, forecast and trend analysis, 2014 to 2025 (USD Million)
FIGURE Italy Permanent Magnets market size, forecast and trend analysis, 2014 to 2025 (USD Million)
FIGURE UK Permanent Magnets market size, forecast and trend analysis, 2014 to 2025 (USD Million)
FIGURE France Permanent Magnets market size, forecast and trend analysis, 2014 to 2025 (USD Million)
FIGURE Rest of the Europe Permanent Magnets market size, forecast and trend analysis, 2014 to 2025 (USD Million)
FIGURE Asia Pacific Permanent Magnets market share analysis by country, 2018
FIGURE India Permanent Magnets market size, forecast and trend analysis, 2014 to 2025 (USD Million)
FIGURE China Permanent Magnets market size, forecast and trend analysis, 2014 to 2025 (USD Million)
FIGURE Japan Permanent Magnets market size, forecast and trend analysis, 2014 to 2025 (USD Million)
FIGURE South Korea Permanent Magnets market size, forecast and trend analysis, 2014 to 2025 (USD Million)
FIGURE Singapore Permanent Magnets market size, forecast and trend analysis, 2014 to 2025 (USD Million)
FIGURE Rest of APAC Permanent Magnets market size, forecast and trend analysis, 2014 to 2025 (USD Million)
FIGURE Latin America Permanent Magnets market size, forecast and trend analysis, 2014 to 2025 (USD Million)
FIGURE Latin America Permanent Magnets market share analysis by country, 2018
FIGURE Brazil Permanent Magnets market size, forecast and trend analysis, 2014 to 2025 (USD Million)
FIGURE Mexico Permanent Magnets market size, forecast and trend analysis, 2014 to 2025 (USD Million)
FIGURE Argentina Permanent Magnets market size, forecast and trend analysis, 2014 to 2025 (USD Million)
FIGURE Rest of LATAM Permanent Magnets market size, forecast and trend analysis, 2014 to 2025 (USD Million)
FIGURE Middle East and Africa Permanent Magnets market size, forecast and trend analysis, 2014 to 2025 (USD Million)
FIGURE Middle East and Africa Permanent Magnets market share analysis by country, 2018
FIGURE Saudi Arabia Permanent Magnets market size, forecast and trend analysis, 2014 to 2025 (USD Million)
FIGURE United Arab Emirates Permanent Magnets market size, forecast and trend analysis, 2014 to 2025 (USD Million)

Related Reports
Credibility and Certifications
Trusted Insights, Certified Excellence! Coherent Market Insights is a certified data advisory and business consulting firm recognized by global institutes.
 ISO 9001:2015
 ESOMAR Corporate
 GDPR Compliance
 D-U-N-S Registered
 BBB Accreditation
 MRS
MRS
