Stone Paper Market, By Product (Rich Mineral Paper Double Coated, and Rich Mineral Board Double Coated), By Material (High-density Polyethylene, and Calcium Carbonate), By Application, By Distribution Channel, and Geography (North America, Europe, Asia Pacific, Middle East & Africa, and Latin America) Analysis, Share, Trends, Size, & Forecast from 2019 2025


REPORT HIGHLIGHT
The stone Paper market was valued at USD 15.41 billion by 2018, growing with 6.0% CAGR during the forecast period, 2019-2025.
The global stone paper market will derive growth from the ease of availability of products required for manufacture. According to a report by AnalystView Market Insights, titled “Stone Paper Industry Analysis and Forecast to 2025”, the market was valued at USD 15.41 billion in 2018. Driven by growing demand and increased applications, the market is projected to reach USD 22.13, thereby exhibiting a CAGR of 6.0%.
Stone paper is a type of paper that is made from calcium carbonate and bio-polyethylene. It is used across several applications such as paper bags, packaging, wrappers, and decorative purposes. The ability of this product to resist small cuts, tears and grease has led to a wider product adoption across the world. Properties such as waterproof nature and weight equivalent to that of tissue have fuelled the demand for this product in recent years. Furthermore, it can be recycled and disposable in the normal way. Once used, it can be recycled and can be converted back into limestone. The ease of manufacturing of stone paper has allowed production in bulk.
Ease of Availability of Core-derivative Materials to Drive the Market
Stone paper is produced through a combination of calcium carbonate and high-density polyethylene (HDPE). The availability of the product in abundance, coupled with the increasing demand will have a positive impact on the global stone paper market in the coming years.
The ease of availability of these materials has allowed widespread applications. The properties of these materials have enabled applications such as banners, fuel tanks, chemical resistant piping, and a few other industrial applications. The availability of calcium carbonate at lower prices will enable the growth of this segment in the coming years.
Application Takeaway
Packaging and Self-Adhesive Paper Segments to Exhibit High Growth Rate
The report segments the industry on the basis of application into self-adhesive, packaging, and labeling paper. Among these segments, the packaging paper segment is likely to witness the highest growth rate in the coming years, owing to the favorable properties of the product. The constantly rising global population has created an increased need for packaging paper. Changing consumer lifestyle, coupled with increasing disposable incomes of people in developing as well as under-developed nations, will aid the growth of this segment.
Besides packaging, the self-adhesive segment will witness considerable growth, owing to the increasing awareness regarding the effects of paper manufacturing methods on the environment. Additionally, increasing government initiatives taken to reduce the usage of plastic has created a subsequent need for the use of a sustainable alternative. As stone paper caters to the strict environmental policies regarding environmental preservation, the self-adhesive segment will continue to rise at a considerable rate.
 Regional Takeaway
The Asia Pacific Dominates the Global Market
The report segments the market on the basis of demographics into North America, Europe, Latin America, Asia Pacific, and the Middle East and Africa. Among these regions, Asia Pacific accounts for the highest market share as of 2018. The growing investments in the research and development of sustainable alternatives to pulp-based paper will aid the growth of the market in the Asia Pacific. Besides Asia Pacific, the regional markets of Europe and North America will exhibit a considerable growth rate, driven by the massive demand for this product in the packaging industries.
Key Vendors Takeaway
A few of the prominent companies are adopting standout business strategies such as company mergers, acquisitions, collaborations, and agreements. Some of the leading companies that are currently operating in the global stone paper market are Sòluz Stone Paper S.A., Stone Paper Company, Packaging Corporation and Gaia-Concept BV, Parax Paper, Taiwan Lung Meng Technology, KapStone, and Gaiakraft.
The market size and forecast for each segment and sub-segments has been considered as below:
- Historical Year – 2014 & 2016
- Base Year – 2018
- Estimated Year – 2019
- Projected Year – 2025
TARGET AUDIENCE
- Traders, Distributors, and Suppliers
- Manufacturers
- Government and Regional Agencies
- Research Organizations
- Consultants
- Distributors
SCOPE OF THE REPORT
The scope of this report covers the market by its major segments, which include as follows:
KEY COMPANIES
- Sòluz Stone Paper S.A.
- Gaia-Concept BV
- Stone Paper Company
- Packaging Corporation
- WestRock Company
- Parax Paper
- Taiwan Lung Meng Technology Co., Ltd.
- Heart Stone Paper
- Mondi Packaging Trebsen GmbH
- Dongguan AM Packaging Company
- KapStone
- Gaiakraft
MARKET, BY PRODUCT
- Rich Mineral Paper Double Coated Stone Paper (RPD)
- Rich Mineral Board Double Coated Stone Paper (RBD)
MARKET, BY MATERIAL
- Calcium Carbonate
- High-density Polyethylene (HDPE)
MARKET, BY APPLICATION
- Paper Packaging
- Labeling Paper
- Self-adhesive Paper
- Others
MARKET, BY DISTRIBUTION CHANNEL
- Direct Sales
- Online
- Retail
MARKET, BY REGION
- North America
- U.S.
- Canada
- Europe
- Germany
- France
- Italy
- Spain
- United Kingdom
- Rest of Europe
- Asia Pacific
- India
- China
- South Korea
- Japan
- Singapore
- Rest of APAC
- Latin America
- Brazil
- Mexico
- Argentina
- Rest of LATAM
- Middle East and Africa
- Saudi Arabia
- United Arab Emirates
- Rest of MEA
TABLE OF CONTENT
1.STONE PAPER MARKET OVERVIEW
1.1.Study Scope
1.2.Assumption and Methodology
2.EXECUTIVE SUMMARY
2.1.Market Snippet
2.1.1.Market Snippet by Product
2.1.2.Market Snippet by Material
2.1.3.Market Snippet by Application
2.1.4.Market Snippet by Region
2.2.Competitive Insights
3.STONE PAPER KEY MARKET TRENDS
3.1.Market Drivers
3.1.1.Impact Analysis of Market Drivers
3.2.Market Restraints
3.2.1.Impact Analysis of Market Restraints
3.3.Market Opportunities
3.4.Market Future Trends
4.STONE PAPER INDUSTRY STUDY
4.1.Porter’s Five Forces Analysis
4.2.Marketing Strategy Analysis
4.3.Growth Prospect Mapping
4.4.Regulatory Framework Analysis
5.STONE PAPER MARKET LANDSCAPE
5.1.Market Share Analysis
5.2.Key Innovators
5.3.Breakdown Data, by Key manufacturer
5.3.1.Established Player Analysis
5.3.2.Emerging Player Analysis
6.STONE PAPER MARKET – BY PRODUCT
6.1.Overview
6.1.1.Segment Share Analysis, By Product, 2018 & 2025 (%)
6.2.Rich Mineral Paper Double Coated Stone Paper (RPD)
6.2.1.Overview
6.2.2.Market Analysis, Forecast, and Y-O-Y Growth Rate, 2014 – 2025, (US$ Million)
6.3.Rich Mineral Board Double Coated Stone Paper (RBD)
6.3.1.Overview
6.3.2.Market Analysis, Forecast, and Y-O-Y Growth Rate, 2014 – 2025, (US$ Million)
7.STONE PAPER MARKET – BY MATERIAL
7.1.Overview
7.1.1.Segment Share Analysis, By Material, 2018 & 2025 (%)
7.2.Calcium Carbonate
7.2.1.Overview
7.2.2.Market Analysis, Forecast, and Y-O-Y Growth Rate, 2014 – 2025, (US$ Million)
7.3.HDPE
7.3.1.Overview
7.3.2.Market Analysis, Forecast, and Y-O-Y Growth Rate, 2014 – 2025, (US$ Million)
8.STONE PAPER MARKET – BY APPLICATION
8.1.Overview
8.1.1.Segment Share Analysis, By End-Use, 2018 & 2025 (%)
8.2.Paper Packaging
8.2.1.Overview
8.2.2.Market Analysis, Forecast, and Y-O-Y Growth Rate, 2014 – 2025, (US$ Million)
8.3.Labeling Paper
8.3.1.Overview
8.3.2.Market Analysis, Forecast, and Y-O-Y Growth Rate, 2014 – 2025, (US$ Million)
8.4.Self-adhesive Paper
8.4.1.Overview
8.4.2.Market Analysis, Forecast, and Y-O-Y Growth Rate, 2014 – 2025, (US$ Million)
8.5.Others
8.5.1.Overview
8.5.2.Market Analysis, Forecast, and Y-O-Y Growth Rate, 2014 – 2025, (US$ Million)
9.STONE PAPER MARKET– BY GEOGRAPHY
9.1.Introduction
9.1.1.Segment Share Analysis, By Region, 2018 & 2025 (%)
9.2.North America
9.2.1.Overview
9.2.2.Key Manufacturers in North America
9.2.3.North America Market Size and Forecast, By Country, 2014 – 2025 (US$ Million)
9.2.4.North America Market Size and Forecast, By Product, 2014 – 2025 (US$ Million)
9.2.5.North America Market Size and Forecast, By Material, 2014 – 2025 (US$ Million)
9.2.6.North America Market Size and Forecast, By Application, 2014 – 2025 (US$ Million)
9.2.7.U.S.
9.2.7.1.Overview
9.2.7.2.Market Analysis, Forecast, and Y-O-Y Growth Rate, 2014 – 2025, (US$ Million)
9.2.8.Canada
9.2.8.1.Overview
9.2.8.2.Market Analysis, Forecast, and Y-O-Y Growth Rate, 2014 – 2025, (US$ Million)
9.3.Europe
9.3.1.Overview
9.3.2.Key Manufacturers in Europe
9.3.3.Europe Market Size and Forecast, By Country, 2014 – 2025 (US$ Million)
9.3.4.Europe Market Size and Forecast, By Product, 2014 – 2025 (US$ Million)
9.3.5.Europe Market Size and Forecast, By Material, 2014 – 2025 (US$ Million)
9.3.6.Europe Market Size and Forecast, By Application, 2014 – 2025 (US$ Million)
9.3.7.Germany
9.3.7.1.Overview
9.3.7.2.Market Analysis, Forecast, and Y-O-Y Growth Rate, 2014 – 2025, (US$ Million)
9.3.8.Italy
9.3.8.1.Overview
9.3.8.2.Market Analysis, Forecast, and Y-O-Y Growth Rate, 2014 – 2025, (US$ Million)
9.3.9.United Kingdom
9.3.9.1.Overview
9.3.9.2.Market Analysis, Forecast, and Y-O-Y Growth Rate, 2014 – 2025, (US$ Million)
9.3.10.France
9.3.10.1.Overview
9.3.10.2.Market Analysis, Forecast, and Y-O-Y Growth Rate, 2014 – 2025, (US$ Million)
9.3.11.Rest of Europe
9.3.11.1.Overview
9.3.11.2.Market Analysis, Forecast, and Y-O-Y Growth Rate, 2014 – 2025, (US$ Million)
9.4.Asia Pacific (APAC)
9.4.1.Overview
9.4.2.Key Manufacturers in Asia Pacific
9.4.3.Asia Pacific Market Size and Forecast, By Country, 2014 – 2025 (US$ Million)
9.4.4.Asia Pacific Market Size and Forecast, By Product, 2014 – 2025 (US$ Million)
9.4.5.Asia Pacific Market Size and Forecast, By Material, 2014 – 2025 (US$ Million)
9.4.6.Asia Pacific Market Size and Forecast, By Application, 2014 – 2025 (US$ Million)
9.4.7.India
9.4.7.1.Overview
9.4.7.2.Market Analysis, Forecast, and Y-O-Y Growth Rate, 2014 – 2025, (US$ Million)
9.4.8.China
9.4.8.1.Overview
9.4.8.2.Market Analysis, Forecast, and Y-O-Y Growth Rate, 2014 – 2025, (US$ Million)
9.4.9.Japan
9.4.9.1.Overview
9.4.9.2.Market Analysis, Forecast, and Y-O-Y Growth Rate, 2014 – 2025, (US$ Million)
9.4.10.South Korea
9.4.10.1.Overview
9.4.10.2.Market Analysis, Forecast, and Y-O-Y Growth Rate, 2014 – 2025, (US$ Million)
9.4.11.Rest of APAC
9.4.11.1.Overview
9.4.11.2.Market Analysis, Forecast, and Y-O-Y Growth Rate, 2014 – 2025, (US$ Million)
9.5.Latin America
9.5.1.Overview
9.5.2.Key Manufacturers in Latin America
9.5.3.Latin America Market Size and Forecast, By Country, 2014 – 2025 (US$ Million)
9.5.4.Latin America Market Size and Forecast, By Product, 2014 – 2025 (US$ Million)
9.5.5.Latin America Market Size and Forecast, By Material, 2014 – 2025 (US$ Million)
9.5.6.Latin America Market Size and Forecast, By Application, 2014 – 2025 (US$ Million)
9.5.7.Brazil
9.5.7.1.Overview
9.5.7.2.Market Analysis, Forecast, and Y-O-Y Growth Rate, 2014 – 2025, (US$ Million)
9.5.8.Mexico
9.5.8.1.Overview
9.5.8.2.Market Analysis, Forecast, and Y-O-Y Growth Rate, 2014 – 2025, (US$ Million)
9.5.9.Argentina
9.5.9.1.Overview
9.5.9.2.Market Analysis, Forecast, and Y-O-Y Growth Rate, 2014 – 2025, (US$ Million)
9.5.10.Rest of LATAM
9.5.10.1.Overview
9.5.10.2.Market Analysis, Forecast, and Y-O-Y Growth Rate, 2014 – 2025, (US$ Million)
9.6.Middle East and Africa
9.6.1.Overview
9.6.2.Key Manufacturers in Middle East and Africa
9.6.3.Middle East and Africa Market Size and Forecast, By Country, 2014 – 2025 (US$ Million)
9.6.4.Middle East and Africa Market Size and Forecast, By Product, 2014 – 2025 (US$ Million)
9.6.5.Middle East and Africa Market Size and Forecast, By Material, 2014 – 2025 (US$ Million)
9.6.6.Middle East and Africa Market Size and Forecast, By Application, 2014 – 2025 (US$ Million)
9.6.7.Saudi Arabia
9.6.7.1.Overview
9.6.7.2.Market Analysis, Forecast, and Y-O-Y Growth Rate, 2014 – 2025, (US$ Million)
9.6.8.United Arab Emirates
9.6.8.1.Overview
9.6.8.2.Market Analysis, Forecast, and Y-O-Y Growth Rate, 2014 – 2025, (US$ Million)
10.KEY VENDOR ANALYSIS
10.1.Hitachi Chemical
10.1.1.Company Snapshot
10.1.2.Financial Performance
10.1.3.Product Benchmarking
10.1.4.Strategic Initiatives
10.2.HBL Power Systems
10.3.Teledyne Technologies
10.4.Hankook AltasBX
10.5.Rolls Battery
10.6.Camel Power
10.7.Amara Raja Power System
10.8.Okaya Power
10.9.XUPAI Battery
10.10.First National Battery
10.11.Clarios
10.12.NorthStar
10.13.Narada Power Source Co., Ltd.
10.14.EnerSys
10.15.Crown Battery Manufacturing
10.16.Johnson Controls
10.17.C&D Technologies, Inc.
10.18.GS Yuasa Corporation
10.19.ATLASBX Co. Ltd.
10.20.Exide Technologies
10.21.Leoch International Technology Ltd.
11.360 DEGREE ANALYSTVIEW
12.APPENDIX
12.1.Research Methodology
12.2.References
12.3.Abbreviations
12.4.Disclaimer
12.5.Contact Us
List of Tables
TABLE List of data sources
TABLE Market drivers; Impact Analysis
TABLE Market restraints; Impact Analysis
TABLE Stone Paper market: Product Snapshot (2018)
TABLE Segment Dashboard; Definition and Scope, by Product
TABLE Global Stone Paper market, by Product 2014-2025 (USD Million)
TABLE Stone Paper market: Material Snapshot (2018)
TABLE Segment Dashboard; Definition and Scope, by Material
TABLE Global Stone Paper market, by Material 2014-2025 (USD Million)
TABLE Stone Paper market: Application Snapshot (2018)
TABLE Segment Dashboard; Definition and Scope, by Application
TABLE Global Stone Paper market, by Application 2014-2025 (USD Million)
fTABLE Stone Paper market: Regional snapshot (2018)
TABLE Segment Dashboard; Definition and Scope, by Region
TABLE Global Stone Paper market, by Region 2014-2025 (USD Million)
TABLE North America Stone Paper market, by Country, 2014-2025 (USD Million)
TABLE North America Stone Paper market, by Product, 2014-2025 (USD Million)
TABLE North America Stone Paper market, by Material, 2014-2025 (USD Million)
TABLE North America Stone Paper market, by Application, 2014-2025 (USD Million)
TABLE Europe Stone Paper market, by country, 2014-2025 (USD Million)
TABLE Europe Stone Paper market, by Product, 2014-2025 (USD Million)
TABLE Europe Stone Paper market, by Material, 2014-2025 (USD Million)
TABLE Europe Stone Paper market, by Application, 2014-2025 (USD Million)
TABLE Asia Pacific Stone Paper market, by country, 2014-2025 (USD Million)
TABLE Asia Pacific Stone Paper market, by Product, 2014-2025 (USD Million)
TABLE Asia Pacific Stone Paper market, by Material, 2014-2025 (USD Million)
TABLE Asia Pacific Stone Paper market, by Application, 2014-2025 (USD Million)
TABLE Latin America Stone Paper market, by country, 2014-2025 (USD Million)
TABLE Latin America Stone Paper market, by Product, 2014-2025 (USD Million)
TABLE Latin America Stone Paper market, by Material, 2014-2025 (USD Million)
TABLE Latin America Stone Paper market, by Application, 2014-2025 (USD Million)
TABLE Middle East and Africa Stone Paper market, by country, 2014-2025 (USD Million)
TABLE Middle East and Africa Stone Paper market, by Product, 2014-2025 (USD Million)
TABLE Middle East and Africa Stone Paper market, by Material, 2014-2025 (USD Million)
TABLE Middle East and Africa Stone Paper market, by Application, 2014-2025 (USD Million)
List of Figures
FIGURE Stone Paper market segmentation
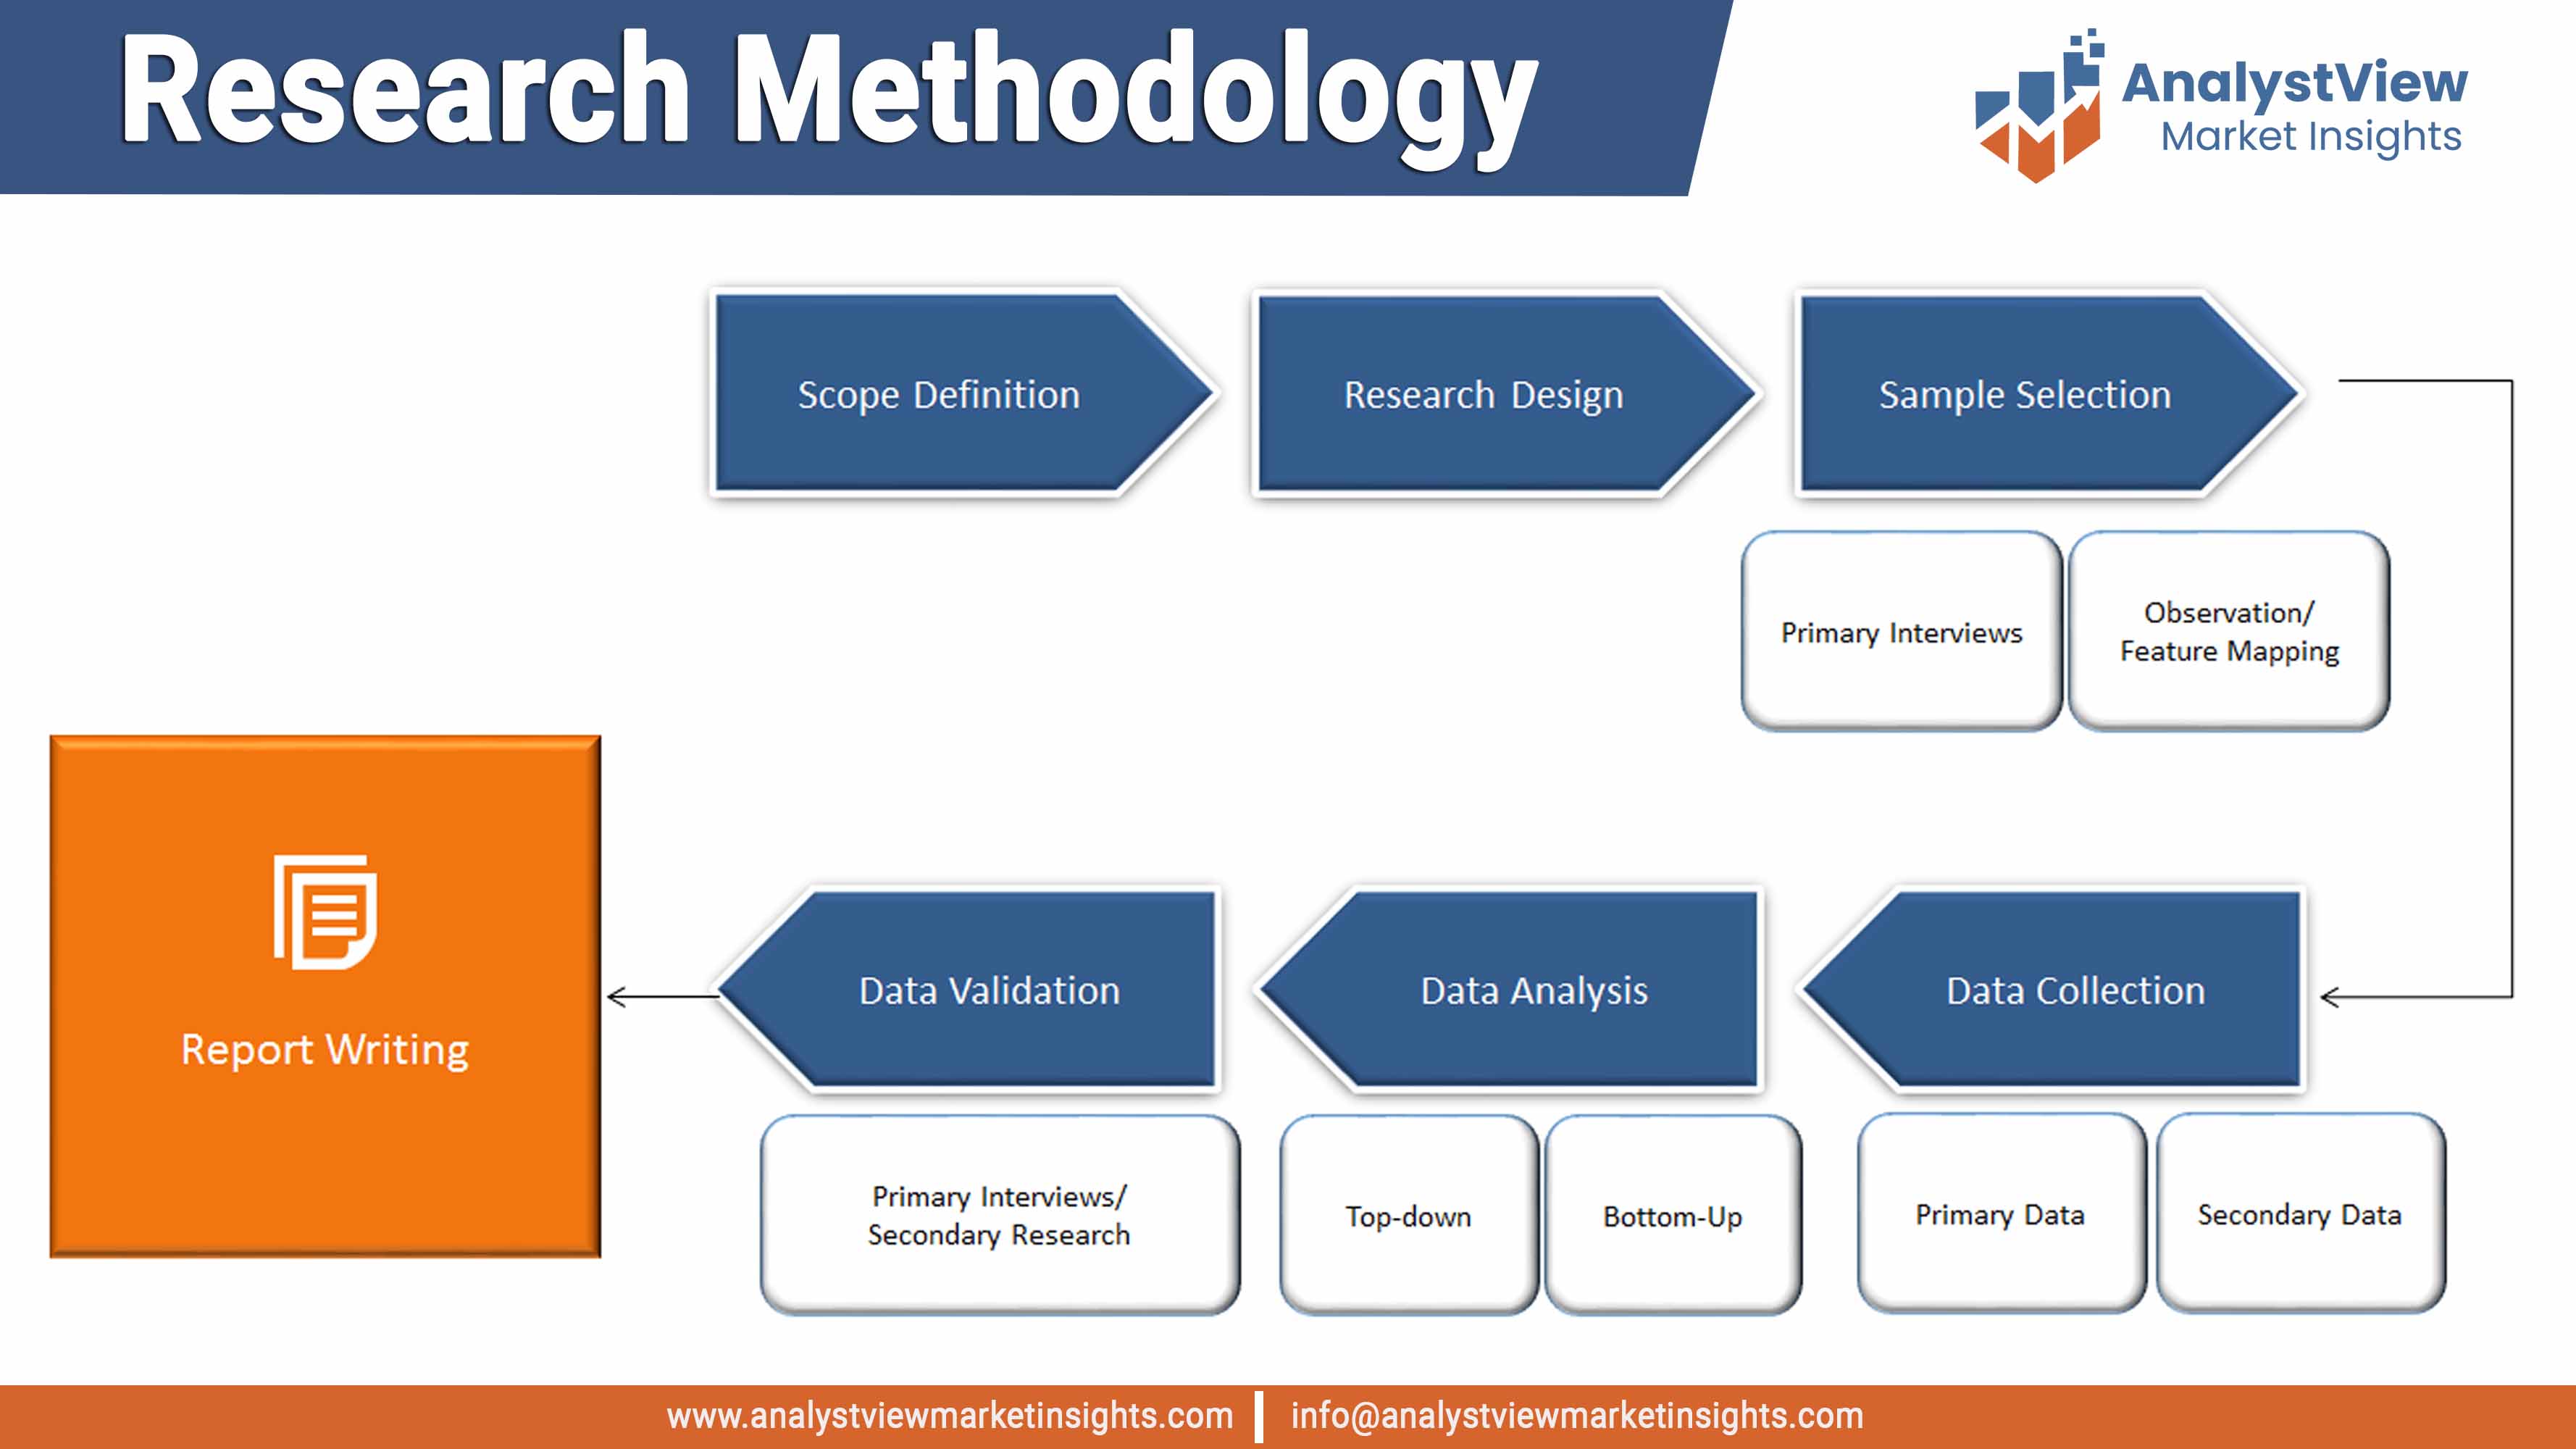
FIGURE Market research methodology
FIGURE Value chain analysis
FIGURE Porter’s Five Forces Analysis
FIGURE Market Attractiveness Analysis
FIGURE Competitive Landscape; Key company market share analysis, 2018
FIGURE Product segment market share analysis, 2018 & 2025
FIGURE Product segment market size forecast and trend analysis, 2014 to 2025 (USD Million)
FIGURE Rich Mineral Paper Double Coated Stone Paper (RPD) market size forecast and trend analysis, 2014 to 2025 (USD Million)
FIGURE Rich Mineral Board Double Coated Stone Paper (RBD) market size forecast and trend analysis, 2014 to 2025 (USD Million)
FIGURE Stationary market size forecast and trend analysis, 2014 to 2025 (USD Million)
FIGURE Material segment market share analysis, 2018 & 2025
FIGURE Material segment market size forecast and trend analysis, 2014 to 2025 (USD Million)
FIGURE Calcium Carbonate market size forecast and trend analysis, 2014 to 2025 (USD Million)
FIGURE HDPE market size forecast and trend analysis, 2014 to 2025 (USD Million)
FIGURE Material segment market share analysis, 2018 & 2025
FIGURE Material segment market size forecast and trend analysis, 2014 to 2025 (USD Million)
FIGURE Paper Packaging market size forecast and trend analysis, 2014 to 2025 (USD Million)
FIGURE Labeling Paper market size forecast and trend analysis, 2014 to 2025 (USD Million)
FIGURE Self-adhesive Paper market size forecast and trend analysis, 2014 to 2025 (USD Million)
FIGURE Others market size forecast and trend analysis, 2014 to 2025 (USD Million)
FIGURE Regional segment market share analysis, 2018 & 2025
FIGURE Regional segment market size forecast and trend analysis, 2014 to 2025 (USD Million)
FIGURE North America Stone Paper market share and leading players, 2018
FIGURE Europe Stone Paper market share and leading players, 2018
FIGURE Asia Pacific Stone Paper market share and leading players, 2018
FIGURE Latin America Stone Paper market share and leading players, 2018
FIGURE Middle East and Africa Stone Paper market share and leading players, 2018
FIGURE North America market share analysis by country, 2018
FIGURE U.S. market size, forecast and trend analysis, 2014 to 2025 (USD Million)
FIGURE Canada market size, forecast and trend analysis, 2014 to 2025 (USD Million)
FIGURE Europe market share analysis by country, 2018
FIGURE Germany market size, forecast and trend analysis, 2014 to 2025 (USD Million)
FIGURE Spain market size, forecast and trend analysis, 2014 to 2025 (USD Million)
FIGURE Italy market size, forecast and trend analysis, 2014 to 2025 (USD Million)
FIGURE UK market size, forecast and trend analysis, 2014 to 2025 (USD Million)
FIGURE France market size, forecast and trend analysis, 2014 to 2025 (USD Million)
FIGURE Rest of the Europe market size, forecast and trend analysis, 2014 to 2025 (USD Million)
FIGURE Asia Pacific market share analysis by country, 2018
FIGURE India market size, forecast and trend analysis, 2014 to 2025 (USD Million)
FIGURE China market size, forecast and trend analysis, 2014 to 2025 (USD Million)
FIGURE Japan market size, forecast and trend analysis, 2014 to 2025 (USD Million)
FIGURE South Korea market size, forecast and trend analysis, 2014 to 2025 (USD Million)
FIGURE Singapore market size, forecast and trend analysis, 2014 to 2025 (USD Million)
FIGURE Rest of APAC market size, forecast and trend analysis, 2014 to 2025 (USD Million)
FIGURE Latin America market size, forecast and trend analysis, 2014 to 2025 (USD Million)
FIGURE Latin America market share analysis by country, 2018
FIGURE Brazil market size, forecast and trend analysis, 2014 to 2025 (USD Million)
FIGURE Mexico market size, forecast and trend analysis, 2014 to 2025 (USD Million)
FIGURE Argentina market size, forecast and trend analysis, 2014 to 2025 (USD Million)
FIGURE Rest of LATAM market size, forecast and trend analysis, 2014 to 2025 (USD Million)
FIGURE Middle East and Africa market size, forecast and trend analysis, 2014 to 2025 (USD Million)
FIGURE Middle East and Africa market share analysis by country, 2018
FIGURE Saudi Arabia market size, forecast and trend analysis, 2014 to 2025 (USD Million)
FIGURE United Arab Emirates market size, forecast and trend analysis, 2014 to 2025 (USD Million)
