Smart Cities Market, By Application (Smart Governance, Utilities, Healthcare, Transportation, Utilities, Building, and Environmental Solution) andGeography (North America, Europe, Asia Pacific, Middle East & Africa, and Latin America) Analysis, Share, Trends, Size, & Forecast from 2019 2025
Report Code: AV443
Industry: Semiconductor and Electronics
Publiced On: 2020-11-01
Pages: 151
Format:


REPORT HIGHLIGHT
The smart cities market was valued at USD 70.9 billion by 2018, growing with 15.9% CAGR during the forecast period, 2019-2025.
Smart cities are a framework that has utilized operational and information technologies to develop, deploy and promote sustainable development practices. Also, such technologies help in analysing and managing data in real-time to help enterprises, municipalities, and citizens to improve the quality of life. This model is aimed to improve both the quality of citizen welfare and government services. A growing number of population migrating toward cities support industry development. As per the United Nations Population Division data, more than 50% of the population worldwide live in cities as of 2018 and this proportion is projected to reach 66% by 2050. This would in turn further fuel the demand for smart cities, supporting the industry development.
In addition, in September 2015 at the United Nations, 193 countries have agreed upon the agenda of the Sustainable Development Goals (SDGs) that will further support fast-track progress for many cities, driving the industry growth. Other driving factors for the growth of this industry are; proactive government initiatives for the development of smart cities, increasing the need for a better-quality life coupled with growing urbanization. On the contrary, lack of technology-related skills coupled with concerns regarding data privacy and security will hamper the market growth to a certain extent.
Application Takeaway
Depending upon the application, the worldwide market is divided into Smart Governance, Healthcare, Transportation, Utilities, Building, and Environmental Solution. Among which, smart utility application accounted for the highest revenue and is also projected grow with the fastest CAGR over the forecast period. This application segment is stepping up as a potential business opportunity for this market. Important breakthroughs in energy & wastewater management and lighting technology will drive the segment growth. For example, Light Emitting Diode (LED) technology enjoying widespread adoption across commercial, industrial and residential settings due to its associated benefits. According to the Energy Information Agency of the U.S. Energy Information Administration (EIA), LED luminaires can result in more than 50% energy savings compared to traditional lighting technology. Such advantages would in turn support this application segment growth.
The smart building and transportation application is anticipated to witness promising growth over the study period, owing to rising favourable government activities to improve public transportation systems and enhance generation and consumption of renewable energy.
 Regional Takeaway
Europe accounted for the highest revenue share in 2018 due to favourable government initiatives for smart cities development. For example, the European Commission (EC) is planning to invest USD 224 million in Smart Cities projects in the next two years. Additionally, as per the European Structural and Investment Funds (ERDF) regulations, around USD 16 a billion funds are to be invested every year towards the development of the smart city through 2014-2020. Such initiatives would, in turn, support regional growth.
The Asia Pacific market is projected to be the fastest-growing region owing to the rising demand for smart solutions for energy management, smart mobility, and infrastructure management. On the contrary, North America dominated the smart healthcare segment with more than 50% share throughout the study period, followed by Europe.
Key Vendors Takeaway
Companies namely ABB Limited, Accenture, Cisco Systems, Inc., Schneider Electric, IBM Corporation, Siemens AG, Oracle Corporation, Microsoft Corporation, Hitachi, Honeywell International, Intel Corporation and Huawei Technologies are actively operating in this market.
Of these, many companies are taking strong initiatives to expand their footprints in this industry. For instance, as an associate member of the Smart Cities Council, an American multinational technology company, Oracle, developed a Smart City Platform to accelerate transformation for its public sector customers.
The market size and forecast for each segment and sub-segments has been considered as below:
- Historical Year – 2014 & 2016
- Base Year – 2018
- Estimated Year – 2019
- Projected Year – 2025
TARGET AUDIENCE
- Traders, Distributors, and Suppliers
- Manufacturers
- Government and Regional Agencies
- Research Organizations
- Consultants
- Distributors
SCOPE OF THE REPORT
The scope of this report covers the market by its major segments, which include as follows:
KEY COMPANIES
- ABB Limited
- Accenture
- Microsoft Corporation
- Hitachi
- Honeywell International
- Intel Corporation
- Huawei Technologies
- Cisco Systems, Inc.
- Schneider Electric
- IBM Corporation
- Siemens AG
- Oracle Corporation
MARKET, BY APPLICATION
- Smart Governance
- Smart Transportation
- Smart Building
- Smart Utilities
- Smart Healthcare
- Environmental Solution
MARKET, BY REGION
- North America
- U.S.
- Canada
- Europe
- Germany
- France
- Italy
- Spain
- United Kingdom
- Rest of Europe
- Asia Pacific
- India
- China
- South Korea
- Japan
- Singapore
- Rest of APAC
- Latin America
- Brazil
- Mexico
- Argentina
- Rest of LATAM
- Middle East and Africa
- Saudi Arabia
- United Arab Emirates
- Rest of MEA
TABLE OF CONTENT
1.SMART CITIES MARKET OVERVIEW
1.1.Study Scope
1.2.Assumption and Methodology
2.EXECUTIVE SUMMARY
2.1.Market Snippet
2.1.1.Market Snippet by Application
2.1.2.Market Snippet by Region
2.2.Competitive Insights
3.SMART CITIES KEY MARKET TRENDS
3.1.Market Drivers
3.1.1.Impact Analysis of Market Drivers
3.2.Market Restraints
3.2.1.Impact Analysis of Market Restraints
3.3.Market Opportunities
3.4.Market Future Trends
4.SMART CITIES INDUSTRY STUDY
4.1.Porter’s Five Forces Analysis
4.2.Marketing Strategy Analysis
4.3.Growth Prospect Mapping
4.4.Regulatory Framework Analysis
5.SMART CITIES MARKET LANDSCAPE
5.1.Market Share Analysis
5.2.Key Innovators
5.3.Breakdown Data, by Key manufacturer
5.3.1.Established Player Analysis
5.3.2.Emerging Player Analysis
6.SMART CITIES MARKET – BY APPLICATION
6.1.Overview
6.1.1.Segment Share Analysis, By Application, 2018 & 2025 (%)
6.2.Epoxy
6.2.1.Overview
6.2.2.Market Analysis, Forecast, and Y-O-Y Growth Rate, 2014 – 2025, (US$ Million)
6.3.Polytetrafluoroethylene (PTFE)
6.3.1.Overview
6.3.2.Market Analysis, Forecast, and Y-O-Y Growth Rate, 2014 – 2025, (US$ Million)
6.4.Ceramic
6.4.1.Overview
6.4.2.Market Analysis, Forecast, and Y-O-Y Growth Rate, 2014 – 2025, (US$ Million)
7.SMART CITIES MARKET– BY GEOGRAPHY
7.1.Introduction
7.1.1.Segment Share Analysis, By Region, 2018 & 2025 (%)
7.2.North America
7.2.1.Overview
7.2.2.Key Manufacturers in North America
7.2.3.North America Market Size and Forecast, By Country, 2014 – 2025 (US$ Million)
7.2.4.North America Market Size and Forecast, By Application, 2014 – 2025 (US$ Million)
7.2.5.U.S.
7.2.5.1.Overview
7.2.5.2.Market Analysis, Forecast, and Y-O-Y Growth Rate, 2014 – 2025, (US$ Million)
7.2.6.Canada
7.2.6.1.Overview
7.2.6.2.Market Analysis, Forecast, and Y-O-Y Growth Rate, 2014 – 2025, (US$ Million)
7.3.Europe
7.3.1.Overview
7.3.2.Key Manufacturers in Europe
7.3.3.Europe Market Size and Forecast, By Country, 2014 – 2025 (US$ Million)
7.3.4.Europe Market Size and Forecast, By Application, 2014 – 2025 (US$ Million)
7.3.5.Germany
7.3.5.1.Overview
7.3.5.2.Market Analysis, Forecast, and Y-O-Y Growth Rate, 2014 – 2025, (US$ Million)
7.3.6.Italy
7.3.6.1.Overview
7.3.6.2.Market Analysis, Forecast, and Y-O-Y Growth Rate, 2014 – 2025, (US$ Million)
7.3.7.United Kingdom
7.3.7.1.Overview
7.3.7.2.Market Analysis, Forecast, and Y-O-Y Growth Rate, 2014 – 2025, (US$ Million)
7.3.8.France
7.3.8.1.Overview
7.3.8.2.Market Analysis, Forecast, and Y-O-Y Growth Rate, 2014 – 2025, (US$ Million)
7.3.9.Rest of Europe
7.3.9.1.Overview
7.3.9.2.Market Analysis, Forecast, and Y-O-Y Growth Rate, 2014 – 2025, (US$ Million)
7.4.Asia Pacific (APAC)
7.4.1.Overview
7.4.2.Key Manufacturers in Asia Pacific
7.4.3.Asia Pacific Market Size and Forecast, By Country, 2014 – 2025 (US$ Million)
7.4.4.Asia Pacific Market Size and Forecast, By Application, 2014 – 2025 (US$ Million)
7.4.5.India
7.4.5.1.Overview
7.4.5.2.Market Analysis, Forecast, and Y-O-Y Growth Rate, 2014 – 2025, (US$ Million)
7.4.6.China
7.4.6.1.Overview
7.4.6.2.Market Analysis, Forecast, and Y-O-Y Growth Rate, 2014 – 2025, (US$ Million)
7.4.7.Japan
7.4.7.1.Overview
7.4.7.2.Market Analysis, Forecast, and Y-O-Y Growth Rate, 2014 – 2025, (US$ Million)
7.4.8.South Korea
7.4.8.1.Overview
7.4.8.2.Market Analysis, Forecast, and Y-O-Y Growth Rate, 2014 – 2025, (US$ Million)
7.4.9.Rest of APAC
7.4.9.1.Overview
7.4.9.2.Market Analysis, Forecast, and Y-O-Y Growth Rate, 2014 – 2025, (US$ Million)
7.5.Latin America
7.5.1.Overview
7.5.2.Key Manufacturers in Latin America
7.5.3.Latin America Market Size and Forecast, By Country, 2014 – 2025 (US$ Million)
7.5.4.Latin America Market Size and Forecast, By Application, 2014 – 2025 (US$ Million)
7.5.5.Brazil
7.5.5.1.Overview
7.5.5.2.Market Analysis, Forecast, and Y-O-Y Growth Rate, 2014 – 2025, (US$ Million)
7.5.6.Mexico
7.5.6.1.Overview
7.5.6.2.Market Analysis, Forecast, and Y-O-Y Growth Rate, 2014 – 2025, (US$ Million)
7.5.7.Argentina
7.5.7.1.Overview
7.5.7.2.Market Analysis, Forecast, and Y-O-Y Growth Rate, 2014 – 2025, (US$ Million)
7.5.8.Rest of LATAM
7.5.8.1.Overview
7.5.8.2.Market Analysis, Forecast, and Y-O-Y Growth Rate, 2014 – 2025, (US$ Million)
7.6.Middle East and Africa
7.6.1.Overview
7.6.2.Key Manufacturers in Middle East and Africa
7.6.3.Middle East and Africa Market Size and Forecast, By Country, 2014 – 2025 (US$ Million)
7.6.4.Middle East and Africa Market Size and Forecast, By Application, 2014 – 2025 (US$ Million)
7.6.5.Saudi Arabia
7.6.5.1.Overview
7.6.5.2.Market Analysis, Forecast, and Y-O-Y Growth Rate, 2014 – 2025, (US$ Million)
7.6.6.United Arab Emirates
7.6.6.1.Overview
7.6.6.2.Market Analysis, Forecast, and Y-O-Y Growth Rate, 2014 – 2025, (US$ Million)
8.KEY VENDOR ANALYSIS
8.1.ABB Limited
8.1.1.Company Snapshot
8.1.2.Financial Performance
8.1.3.Product Benchmarking
8.1.4.Strategic Initiatives
8.2.Accenture
8.3.Microsoft Corporation
8.4.Hitachi
8.5.Honeywell International
8.6.Intel Corporation
8.7.Huawei Technologies
8.8.Cisco Systems, Inc.
8.9.Schneider Electric
8.10.IBM Corporation
8.11.Siemens AG
8.12.Oracle Corporation
9.360 DEGREE ANALYSTVIEW
10.APPENDIX
10.1.Research Methodology
10.2.References
10.3.Abbreviations
10.4.Disclaimer
10.5.Contact Us
List of Tables
TABLE List of data sources
TABLE Market drivers; Impact Analysis
TABLE Market restraints; Impact Analysis
TABLE Smart Cities market: Application Snapshot (2018)
TABLE Segment Dashboard; Definition and Scope, by Application
TABLE Global Smart Cities market, by Application 2014-2025 (USD Million)
fTABLE Smart Cities market: Regional snapshot (2018)
TABLE Segment Dashboard; Definition and Scope, by Region
TABLE Global Smart Cities market, by Region 2014-2025 (USD Million)
TABLE North America Smart Cities market, by Country, 2014-2025 (USD Million)
TABLE North America Smart Cities market, by Application, 2014-2025 (USD Million)
TABLE Europe Smart Cities market, by country, 2014-2025 (USD Million)
TABLE Europe Smart Cities market, by Application, 2014-2025 (USD Million)
TABLE Asia Pacific Smart Cities market, by country, 2014-2025 (USD Million)
TABLE Asia Pacific Smart Cities market, by Application, 2014-2025 (USD Million)
TABLE Latin America Smart Cities market, by country, 2014-2025 (USD Million)
TABLE Latin America Smart Cities market, by Application, 2014-2025 (USD Million)
TABLE Middle East and Africa Smart Cities market, by country, 2014-2025 (USD Million)
TABLE Middle East and Africa Smart Cities market, by Application, 2014-2025 (USD Million)
List of Figures
FIGURE Smart Cities market segmentation
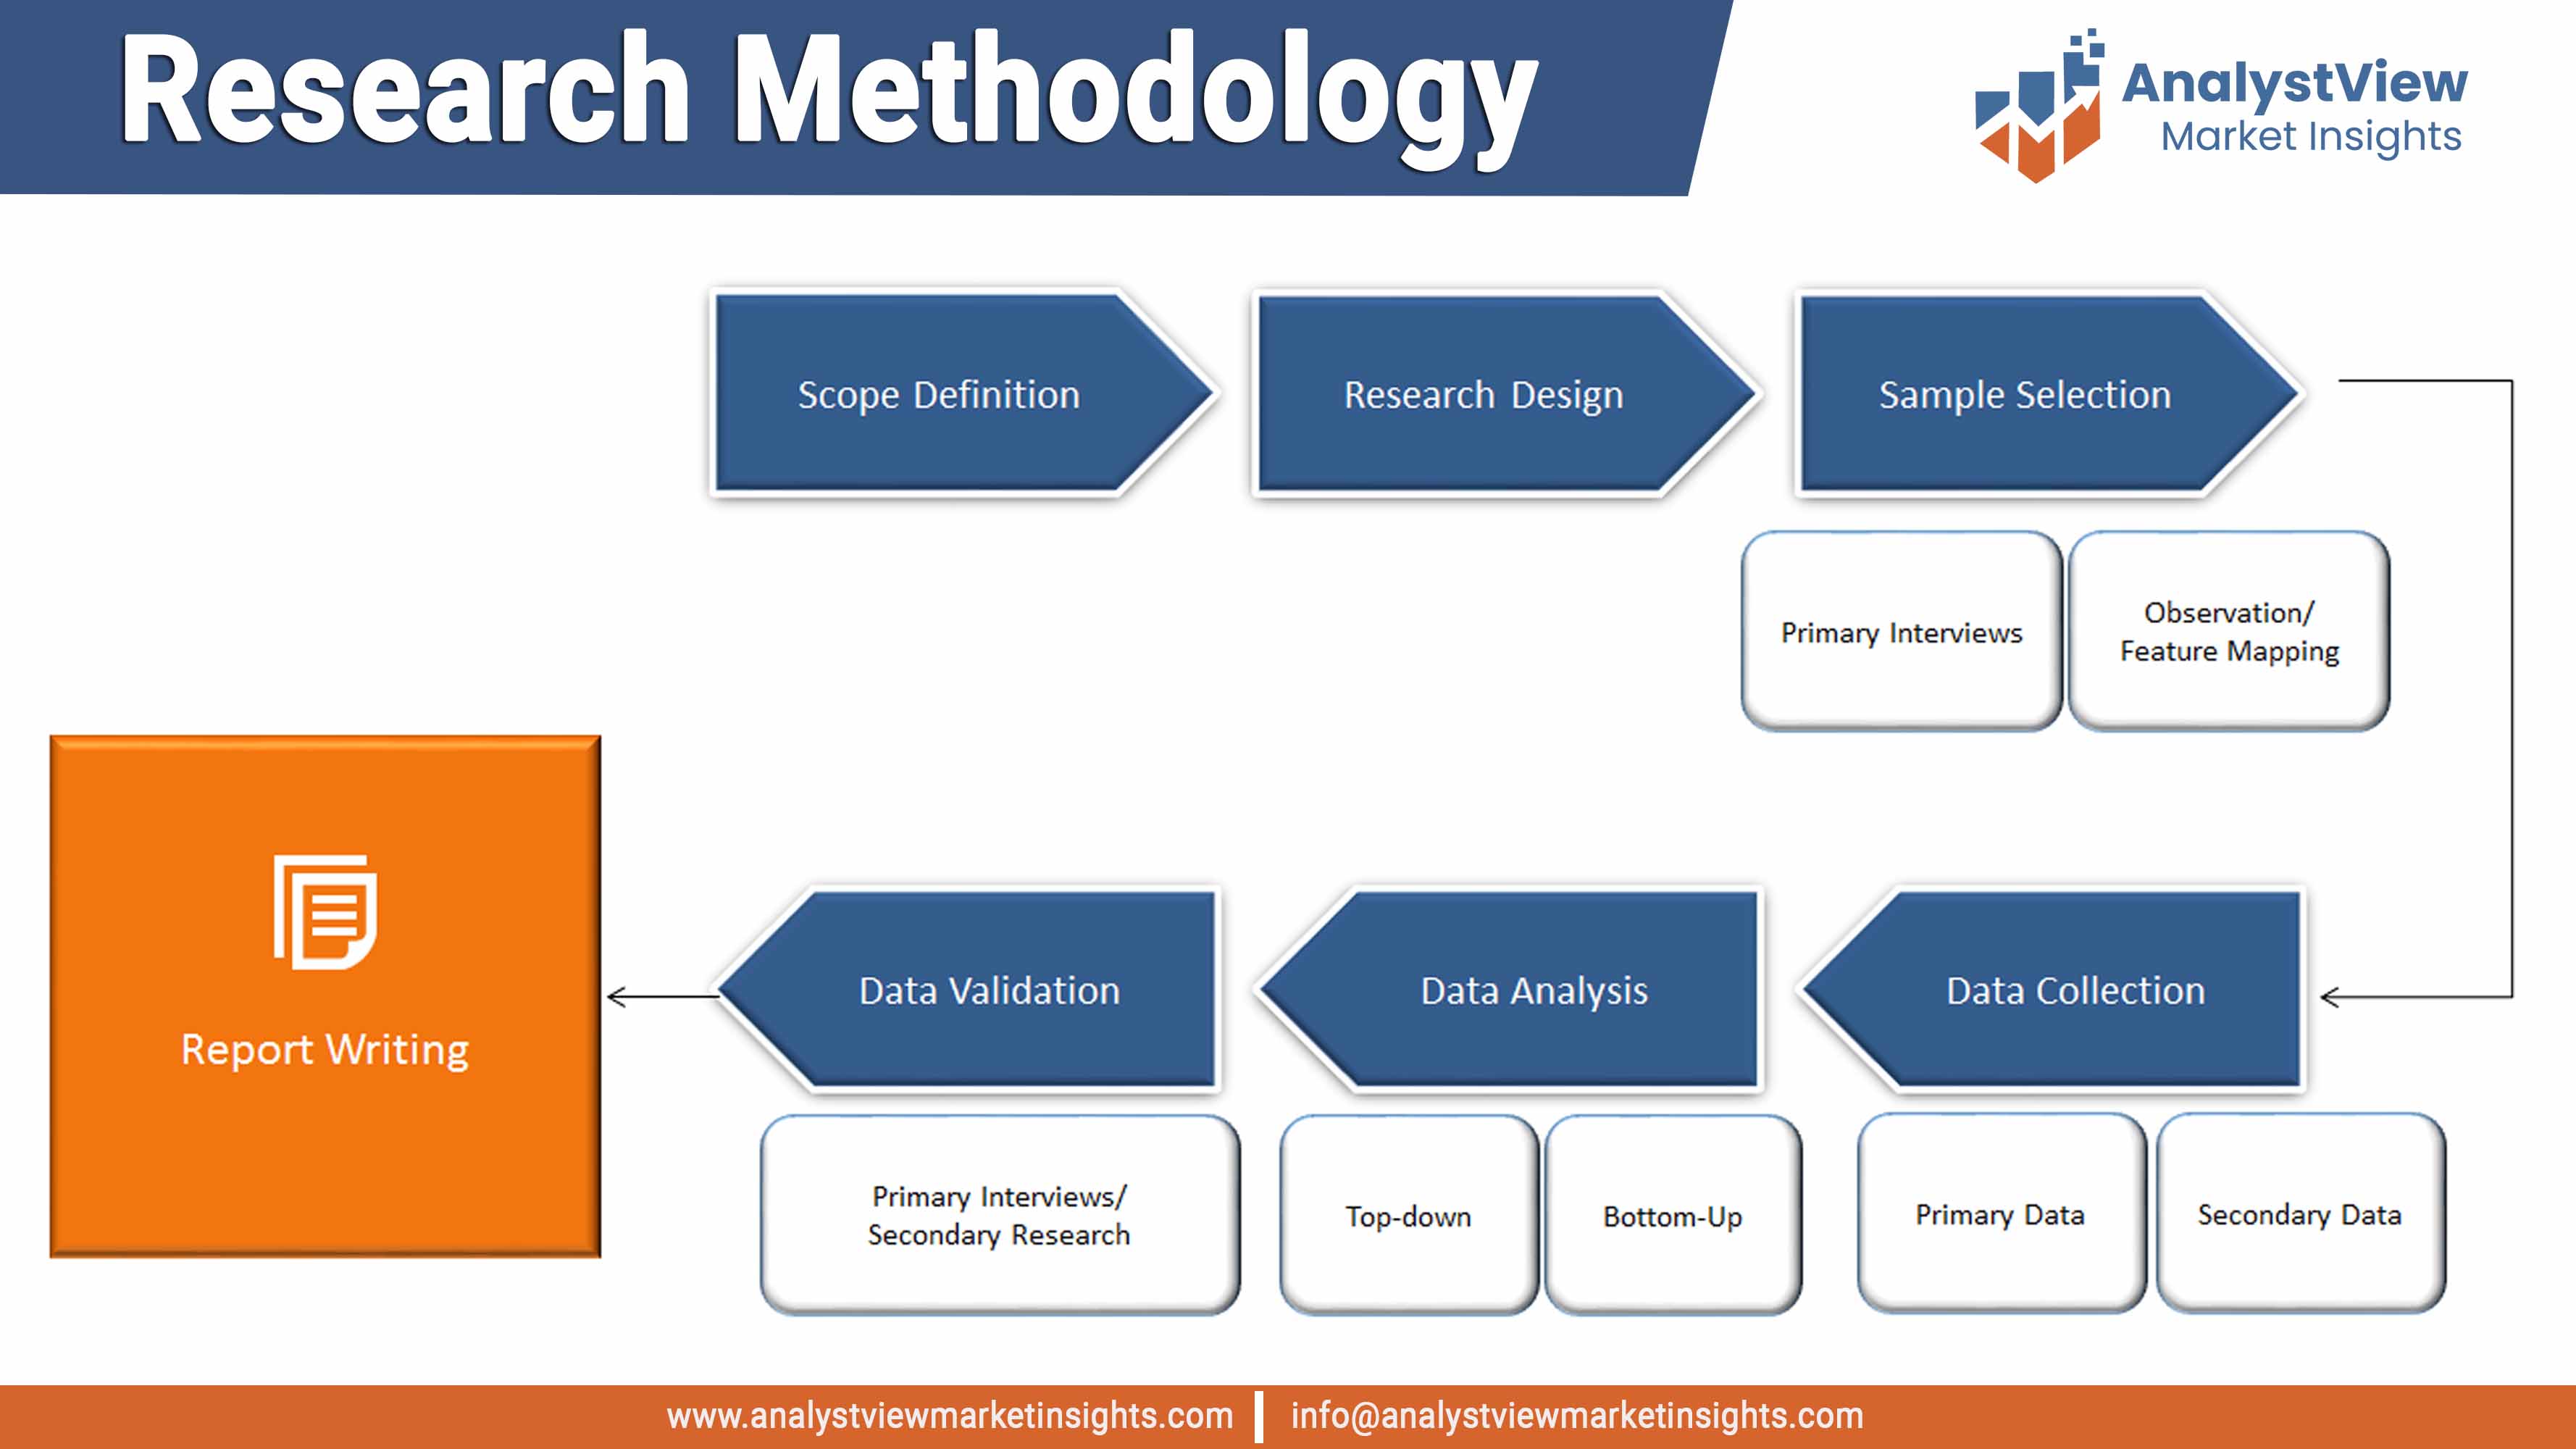
FIGURE Market research methodology
FIGURE Value chain analysis
FIGURE Porter’s Five Forces Analysis
FIGURE Market Attractiveness Analysis
FIGURE Competitive Landscape; Key company market share analysis, 2018
FIGURE Application segment market share analysis, 2018 & 2025
FIGURE Application segment market size forecast and trend analysis, 2014 to 2025 (USD Million)
FIGURE Smart Governance market size forecast and trend analysis, 2014 to 2025 (USD Million)
FIGURE Smart Transportation market size forecast and trend analysis, 2014 to 2025 (USD Million)
FIGURE Smart Building market size forecast and trend analysis, 2014 to 2025 (USD Million)
FIGURE Smart Utilities market size forecast and trend analysis, 2014 to 2025 (USD Million)
FIGURE Smart Healthcare market size forecast and trend analysis, 2014 to 2025 (USD Million)
FIGURE Environmental Solution market size forecast and trend analysis, 2014 to 2025 (USD Million)
FIGURE Regional segment market share analysis, 2018 & 2025
FIGURE Regional segment market size forecast and trend analysis, 2014 to 2025 (USD Million)
FIGURE North America Smart Cities market share and leading players, 2018
FIGURE Europe Smart Cities market share and leading players, 2018
FIGURE Asia Pacific Smart Cities market share and leading players, 2018
FIGURE Latin America Smart Cities market share and leading players, 2018
FIGURE Middle East and Africa Smart Cities market share and leading players, 2018
FIGURE North America market share analysis by country, 2018
FIGURE U.S. market size, forecast and trend analysis, 2014 to 2025 (USD Million)
FIGURE Canada market size, forecast and trend analysis, 2014 to 2025 (USD Million)
FIGURE Europe market share analysis by country, 2018
FIGURE Germany market size, forecast and trend analysis, 2014 to 2025 (USD Million)
FIGURE Spain market size, forecast and trend analysis, 2014 to 2025 (USD Million)
FIGURE Italy market size, forecast and trend analysis, 2014 to 2025 (USD Million)
FIGURE UK market size, forecast and trend analysis, 2014 to 2025 (USD Million)
FIGURE France market size, forecast and trend analysis, 2014 to 2025 (USD Million)
FIGURE Rest of the Europe market size, forecast and trend analysis, 2014 to 2025 (USD Million)
FIGURE Asia Pacific market share analysis by country, 2018
FIGURE India market size, forecast and trend analysis, 2014 to 2025 (USD Million)
FIGURE China market size, forecast and trend analysis, 2014 to 2025 (USD Million)
FIGURE Japan market size, forecast and trend analysis, 2014 to 2025 (USD Million)
FIGURE South Korea market size, forecast and trend analysis, 2014 to 2025 (USD Million)
FIGURE Singapore market size, forecast and trend analysis, 2014 to 2025 (USD Million)
FIGURE Rest of APAC market size, forecast and trend analysis, 2014 to 2025 (USD Million)
FIGURE Latin America market size, forecast and trend analysis, 2014 to 2025 (USD Million)
FIGURE Latin America market share analysis by country, 2018
FIGURE Brazil market size, forecast and trend analysis, 2014 to 2025 (USD Million)
FIGURE Mexico market size, forecast and trend analysis, 2014 to 2025 (USD Million)
FIGURE Argentina market size, forecast and trend analysis, 2014 to 2025 (USD Million)
FIGURE Rest of LATAM market size, forecast and trend analysis, 2014 to 2025 (USD Million)
FIGURE Middle East and Africa market size, forecast and trend analysis, 2014 to 2025 (USD Million)
FIGURE Middle East and Africa market share analysis by country, 2018
FIGURE Saudi Arabia market size, forecast and trend analysis, 2014 to 2025 (USD Million)
FIGURE United Arab Emirates market size, forecast and trend analysis, 2014 to 2025 (USD Million)
