Intravenous Solutions Market, By Solution Type (Vitamins & Minerals, Dextran, Saline, Heparin and Trace Elements, Amino Acid, Lactated Ringers, and Mixed Solutions), By Bag Type (Large and Small Volume Bags) By Type (Total Parenteral Nutrition, and Peripheral Parenteral Nutrition) By Application, By End-use, and By Geography (NA, EU, APAC, LATAM and MEA) Analysis, Share, Trends, Size, & Forecast From 2020 2026


REPORT HIGHLIGHT
Intravenous solutions market was valued at USD 8.94 billion by 2019, growing with 9.8% CAGR during the forecast period, 2020-2026.
Market Dynamics
The intravenous solution includes water, electrolytes, and glucose in the form of a physiological saline solution and glucose solution, having essential micro and macronutrients. Intravenous solutions are directly introduced in the veins as it is the fastest route of fluid delivery. This IV solution has the same osmotic pressure as blood, it does not impart any pressure of the blood vessels even if it is infused in the blood for a longer time. It may also include amino-acid and lipids in varying concentrations. As per the Faculty of Health Centre for Rural Health (Australia), more than 75% of patients admitted into hospital are receiving some type of IV therapy. IV solutions are available in various forms based on the presence of ingredients and their functions. Basic IV solution, nutrient solution, and special infusion solution are some of the product types.
The market is experiencing growth on the grounds of the rise in medical conditions such as cholera, diarrhoea, food-related infections, cancer, hepatitis, resulting in increased patient numbers in hospital admission. According to the World Health Organization (WHO), approximately 1.3 million to 4.0 million people across the world suffered from cholera in 2019. Also, the organization stated that cancer is the second leading cause of death globally, accounted for more than 9.6 million deaths in 2018. IV therapy is recommended by physicians during the treatment protocol for patients who have such chronic conditions, augmenting the industry growth to a great extent.
Furthermore, this therapy is an ideal option for patients suffering from dehydration, diarrhoea, and nutritional deficiency. The rising number of patients with these conditions would, in turn, further stimulates the product demand. Other factors such as new product developments, aging population, rising number of premature births, and malnutrition will create the demand for intravenous solutions, supporting the industry development.
On the counter side, products such as antibiotics and medications used in IV therapy are highly regulated by governments in order to ensure quality and availability to consumers. Strict government regulations coupled with the lack of reimbursement policies hinder the growth of this market. In addition to this, the high cost of vitamin C intravenous therapy is expected to hamper the market growth to some extent.
Solution Type Takeaway
Based on the solution types, the market has been categorized into Lactated Ringer’s, mixed solutions, vitamins & minerals, amino acid, dextran, heparin & trace elements, and saline (normal and hypertonic saline). Among these, the amino acid category dominated the market growth in 2019 as it acts as a building block for body growth. The amino acid infused intravenous solution helps in maintaining the metabolic pathways. On the other hand, Lactated Ringer’s segment is projected to grow with promising CAGR over the future period. It is estimated that 70% of the total IV product range comes from dextrose with normal saline, dextrose 5%, and ringer lactate. All these are available in glass as well as plastic containers.
Bag Type Takeaway
On the basis of bag types, the market is bifurcated into large and small volume bags. Large volume bags (i.e. greater than 250ml) dominated the overall market revenue in 2019. Growing demand for large quantities of IV solution to settle the electrolyte imbalance, deliver essential nutrients and drugs is creating the demand for large volume bags. Furthermore, an increasing number of medical surgeries coupled with hike in patients with chronic disease conditions that demands continuous nutrient supply fuel the segment growth during the study period. On the contrary, the small volume category is projected to grow with promising CAGR over the study period.
Type Takeaway
Depending upon types, the industry is divided into total parenteral nutrition and peripheral parenteral nutrition. Total parenteral nutrition held more than 50% of the total market share in 2019, owing to a better source of providing total nutrition when compared to peripheral parental nutrition. It is a more preferred option than peripheral nutrition to deliver nutrition in a higher concentration of essential components for a longer period of time.
Rising prevalence of digestive disorders, hike in malnutrition cases underdeveloped regions will further create a huge opportunity for this product. According to the United Nations Children’s Fund (UNICEF), the prevalence of malnutrition remains alarming and impacting the lives of many young children in developing regions as well as some developed countries. The World Health Organization revealed that around 462 million people globally are underweight, whereas 45% of child death is often associated with under-nutrition or malnutrition mainly from middle and low-income countries. Such facts will fuel product demand during the future period.
Application Takeaway
Irrigation, nutritional, basic, blood, and drug IV solution are some of the key application areas for this product. In 2019, a basic IV solution emerged as a promising application for the intravenous solution. It is commonly used types as it mainly includes glucose and saline solution with amino acids with the prime purpose to provide water as well as essential solutions to the body. The rise in hospitalization for various infectious diseases and medical conditions is driving demand for basic IV solution for delivering essential nutrients.
End-use Takeaway
On the basis of end-use, the market is further classified into ambulatory, hospitals & clinics, and home care. The hospital achieved a dominating position in 2019 owing to the rise in outpatient volume with upgrading the quality of healthcare services. Technological advancement in the healthcare sector coupled with the rising chronic diseases further drives the segment growth. Ongoing development towards boosting hospital infrastructure to offer more advanced treatment and increase hospital capacity to settle rising outpatient admissions also favors the product demand for hospitals.
Key Vendor Takeaway
Some of the key players that are actively responsible for the growth of this industry are ICU Medical, Baxter International, Grifols, B. Braun Melsungen AG, Fresenius Kabi, JW Life Science, Vifor Pharma Management Limited, Salius Pharma Pvt. Ltd., Axa Parenterals, and Amanta Healthcare.
To alleviate the shortage of the IV solutions key companies are actively operational for increasing production facilities. For instance, in 2019, B. Braun Medical announced an investment of USD 1 billion for construction or expansion of the manufacturing facilities dedicated to production IV fluids. Prominent players are also involved in a strategic collaboration to expand their market presence. In February 2017, ICU Medical acquired the Hospira Infusion Systems business from Pfizer Inc. This acquisition has helped the company to increase its product offering in I.V. solutions, pumps, and devices. In addition, through innovation, key vendors are engaged in developing premixed products for easy use and reduce packaging waste.
The market size and forecast for each segment and sub-segments has been considered as below:
- Historical Year – 2015 to 2018
- Base Year – 2019
- Estimated Year – 2020
- Projected Year – 2026
TARGET AUDIENCE
- Traders, Distributors, and Suppliers
- Manufacturers
- Government and Regional Agencies
- Research Organizations
- Consultants
- Distributors
SCOPE OF THE REPORT
The scope of this report covers the market by its major segments, which include as follows:
INTRAVENOUS SOLUTION PLATFORM MARKET KEY PLAYERS
- Axa Parenterals Ltd
- ICU Medical
- JW Life Science
- Amanta Healthcare
- Baxter International
- Fresenius Kabi
- Vifor Pharma Management
- Braun Melsungen AG
- Grifols, S.A.
- Salius Pharma Private Limited
GLOBAL INTRAVENOUS SOLUTION PLATFORM MARKET BY SOLUTION TYPE
- Amino Acid
- Dextran
- Lactated Ringer’s
- Saline
- Normal Saline (0.9% NaCl)
- Hypertonic Saline
- Vitamins & Minerals
- Mixed Solutions
- Heparin and Trace Elements
GLOBAL INTRAVENOUS SOLUTION PLATFORM MARKET, BY BAG TYPE
- Large Volume Bags (Greater Than 250ml)
- Small Volume Bags (Less Than 250ml)
GLOBAL INTRAVENOUS SOLUTION PLATFORM MARKET, BY TYPE
- Peripheral Parenteral Nutrition
- Total Parenteral Nutrition
GLOBAL INTRAVENOUS SOLUTION PLATFORM MARKET, BY APPLICATION
- Drug IV Solution
- Basic IV Solution
- Blood IV Solution
- Irrigation IV Solution
- Nutritional IV Solution
GLOBAL INTRAVENOUS SOLUTION PLATFORM MARKET, BY END-USE
- Ambulatory
- Home Care
- Hospital & Clinics
GLOBAL INTRAVENOUS SOLUTION PLATFORM MARKET, BY REGION
- North America
- The U.S.
- Canada
- Europe
- Germany
- France
- Italy
- Spain
- United Kingdom
- Rest of Europe
- Asia Pacific
- India
- China
- South Korea
- Japan
- Singapore
- Rest of APAC
- Latin America
- Brazil
- Mexico
- Argentina
- Rest of LATAM
- Middle East and Africa
- Saudi Arabia
- United Arab Emirates
- Rest of MEA
TABLE OF CONTENT
1. INTRAVENOUS SOLUTION MARKET OVERVIEW
1.1. Study Scope
1.2. Assumption and Methodology
2. EXECUTIVE SUMMARY
2.1. Market Snippet
2.1.1. Market Snippet by Solution Type
2.1.2. Market Snippet by Bag Type
2.1.3. Market Snippet by Type
2.1.4. Market Snippet by Application
2.1.5. Market Snippet by End-users
2.1.6. Market Snippet by Region
2.2. Competitive Insights
3. INTRAVENOUS SOLUTION KEY MARKET TRENDS
3.1. Market Drivers
3.1.1. Impact Analysis of Market Drivers
3.2. Market Restraints
3.2.1. Impact Analysis of Market Restraints
3.3. Market Opportunities
3.4. Market Future Trends
4. INTRAVENOUS SOLUTION INDUSTRY STUDY
4.1. Porter’s Five Forces Analysis
4.2. Marketing Strategy Analysis
4.3. Growth Prospect Mapping
4.4. Regulatory Framework Analysis
5. INTRAVENOUS SOLUTION MARKET LANDSCAPE
5.1. Market Share Analysis
5.2. Key Innovators
5.3. Breakdown Data, by Key manufacturer
5.3.1. Established Player Analysis
5.3.2. Emerging Player Analysis
6. INTRAVENOUS SOLUTION MARKET – BY SOLUTION TYPE
6.1. Overview
6.1.1. Segment Share Analysis, By Type, 2019 & 2026 (%)
6.2. Saline
6.2.1. Overview
6.2.2. Market Analysis, Forecast, and Y-O-Y Growth Rate, 2015 – 2026, (US$ Million)
6.2.3. Normal Saline (0.9% NaCl)
6.2.4. Hypertonic Saline
6.3. Dextran
6.3.1. Overview
6.3.2. Market Analysis, Forecast, and Y-O-Y Growth Rate, 2015 – 2026, (US$ Million)
6.4. Lactated Ringer’s
6.4.1. Overview
6.4.2. Market Analysis, Forecast, and Y-O-Y Growth Rate, 2015 – 2026, (US$ Million)
6.5. Amino Acid
6.5.1. Overview
6.5.2. Market Analysis, Forecast, and Y-O-Y Growth Rate, 2015 – 2026, (US$ Million)
6.6. Vitamins & Minerals
6.6.1. Overview
6.6.2. Market Analysis, Forecast, and Y-O-Y Growth Rate, 2015 – 2026, (US$ Million)
6.7. Heparin and Trace Elements
6.7.1. Overview
6.7.2. Market Analysis, Forecast, and Y-O-Y Growth Rate, 2015 – 2026, (US$ Million)
6.8. Mixed Solutions
6.8.1. Overview
6.8.2. Market Analysis, Forecast, and Y-O-Y Growth Rate, 2015 – 2026, (US$ Million)
7. INTRAVENOUS SOLUTION MARKET – BY BAG TYPE
7.1. Overview
7.1.1. Segment Share Analysis, By Type, 2019 & 2026 (%)
7.2. Large Volume Bags (greater than 250ml)
7.2.1. Overview
7.2.2. Market Analysis, Forecast, and Y-O-Y Growth Rate, 2015 – 2026, (US$ Million)
7.3. Small Volume Bags (less than 250ml)
7.3.1. Overview
7.3.2. Market Analysis, Forecast, and Y-O-Y Growth Rate, 2015 – 2026, (US$ Million)
8. INTRAVENOUS SOLUTION MARKET – BY TYPE
8.1. Overview
8.1.1. Segment Share Analysis, By Type, 2019 & 2026 (%)
8.2. Peripheral Parenteral Nutrition
8.2.1. Overview
8.2.2. Market Analysis, Forecast, and Y-O-Y Growth Rate, 2015 – 2026, (US$ Million)
8.3. Total Parenteral Nutrition
8.3.1. Overview
8.3.2. Market Analysis, Forecast, and Y-O-Y Growth Rate, 2015 – 2026, (US$ Million)
9. INTRAVENOUS SOLUTION MARKET – BY APPLICATION
9.1. Overview
9.1.1. Segment Share Analysis, By Application, 2019 & 2026 (%)
9.2. Basic IV Solution
9.2.1. Overview
9.2.2. Market Analysis, Forecast, and Y-O-Y Growth Rate, 2015 – 2026, (US$ Million)
9.3. Nutritional IV Solution
9.3.1. Overview
9.3.2. Market Analysis, Forecast, and Y-O-Y Growth Rate, 2015 – 2026, (US$ Million)
9.4. Blood IV Solution
9.4.1. Overview
9.4.2. Market Analysis, Forecast, and Y-O-Y Growth Rate, 2015 – 2026, (US$ Million)
9.5. Drug IV Solution
9.5.1. Overview
9.5.2. Market Analysis, Forecast, and Y-O-Y Growth Rate, 2015 – 2026, (US$ Million)
9.6. Irrigation IV Solution
9.6.1. Overview
9.6.2. Market Analysis, Forecast, and Y-O-Y Growth Rate, 2015 – 2026, (US$ Million)
10. INTRAVENOUS SOLUTION MARKET – BY END-USERS
10.1. Overview
10.1.1. Segment Share Analysis, By Type, 2019 & 2026 (%)
10.2. Hospital & Clinics
10.2.1. Overview
10.2.2. Market Analysis, Forecast, and Y-O-Y Growth Rate, 2015 – 2026, (US$ Million)
10.3. Ambulatory
10.3.1. Overview
10.3.2. Market Analysis, Forecast, and Y-O-Y Growth Rate, 2015 – 2026, (US$ Million)
10.4. Home Care
10.4.1. Overview
10.4.2. Market Analysis, Forecast, and Y-O-Y Growth Rate, 2015 – 2026, (US$ Million)
11. INTRAVENOUS SOLUTION MARKET– BY GEOGRAPHY
11.1. Introduction
11.1.1. Segment Share Analysis, By Region, 2019 & 2026 (%)
11.2. North America
11.2.1. Overview
11.2.2. Key Manufacturers in North America
11.2.3. North America Market Size and Forecast, By Country, 2015 – 2026 (US$ Million)
11.2.4. North America Market Size and Forecast, By Solution Type, 2015 – 2026 (US$ Million)
11.2.5. North America Market Size and Forecast, By Bag Type, 2015 – 2026 (US$ Million)
11.2.6. North America Market Size and Forecast, By Type, 2015 – 2026 (US$ Million)
11.2.7. North America Market Size and Forecast, By Application, 2015 – 2026 (US$ Million)
11.2.8. North America Market Size and Forecast, By End-users, 2015 – 2026 (US$ Million)
11.2.9. U.S.
11.2.9.1. Overview
11.2.9.2. Market Analysis, Forecast, and Y-O-Y Growth Rate, 2015 – 2026, (US$ Million)
11.2.10. Canada
11.2.10.1. Overview
11.2.10.2. Market Analysis, Forecast, and Y-O-Y Growth Rate, 2015 – 2026, (US$ Million)
11.3. Europe
11.3.1. Overview
11.3.2. Key Manufacturers in Europe
11.3.3. Europe Market Size and Forecast, By Country, 2015 – 2026 (US$ Million)
11.3.4. Europe Market Size and Forecast, By Solution Type, 2015 – 2026 (US$ Million)
11.3.5. Europe Market Size and Forecast, By Bag Type, 2015 – 2026 (US$ Million)
11.3.6. Europe Market Size and Forecast, By Type, 2015 – 2026 (US$ Million)
11.3.7. Europe Market Size and Forecast, By Application, 2015 – 2026 (US$ Million)
11.3.8. Europe Market Size and Forecast, By End-users, 2015 – 2026 (US$ Million)
11.3.9. Germany
11.3.9.1. Overview
11.3.9.2. Market Analysis, Forecast, and Y-O-Y Growth Rate, 2015 – 2026, (US$ Million)
11.3.10. Italy
11.3.10.1. Overview
11.3.10.2. Market Analysis, Forecast, and Y-O-Y Growth Rate, 2015 – 2026, (US$ Million)
11.3.11. United Kingdom
11.3.11.1. Overview
11.3.11.2. Market Analysis, Forecast, and Y-O-Y Growth Rate, 2015 – 2026, (US$ Million)
11.3.12. France
11.3.12.1. Overview
11.3.12.2. Market Analysis, Forecast, and Y-O-Y Growth Rate, 2015 – 2026, (US$ Million)
11.3.13. Rest of Europe
11.3.13.1. Overview
11.3.13.2. Market Analysis, Forecast, and Y-O-Y Growth Rate, 2015 – 2026, (US$ Million)
11.4. Asia Pacific (APAC)
11.4.1. Overview
11.4.2. Key Manufacturers in Asia Pacific
11.4.3. Asia Pacific Market Size and Forecast, By Country, 2015 – 2026 (US$ Million)
11.4.4. Asia Pacific Market Size and Forecast, By Solution Type, 2015 – 2026 (US$ Million)
11.4.5. Asia Pacific Market Size and Forecast, By Bag Type, 2015 – 2026 (US$ Million)
11.4.6. Asia Pacific Market Size and Forecast, By Type, 2015 – 2026 (US$ Million)
11.4.7. Asia Pacific Market Size and Forecast, By Application, 2015 – 2026 (US$ Million)
11.4.8. Asia Pacific Market Size and Forecast, By End-users, 2015 – 2026 (US$ Million)
11.4.9. India
11.4.9.1. Overview
11.4.9.2. Market Analysis, Forecast, and Y-O-Y Growth Rate, 2015 – 2026, (US$ Million)
11.4.10. China
11.4.10.1. Overview
11.4.10.2. Market Analysis, Forecast, and Y-O-Y Growth Rate, 2015 – 2026, (US$ Million)
11.4.11. Japan
11.4.11.1. Overview
11.4.11.2. Market Analysis, Forecast, and Y-O-Y Growth Rate, 2015 – 2026, (US$ Million)
11.4.12. South Korea
11.4.12.1. Overview
11.4.12.2. Market Analysis, Forecast, and Y-O-Y Growth Rate, 2015 – 2026, (US$ Million)
11.4.13. Rest of APAC
11.4.13.1. Overview
11.4.13.2. Market Analysis, Forecast, and Y-O-Y Growth Rate, 2015 – 2026, (US$ Million)
11.5. Latin America
11.5.1. Overview
11.5.2. Key Manufacturers in Latin America
11.5.3. Latin America Market Size and Forecast, By Country, 2015 – 2026 (US$ Million)
11.5.4. Latin America Market Size and Forecast, By Solution Type, 2015 – 2026 (US$ Million)
11.5.5. Latin America Market Size and Forecast, By Bag Type, 2015 – 2026 (US$ Million)
11.5.6. Latin America Market Size and Forecast, By Type, 2015 – 2026 (US$ Million)
11.5.7. Latin America Market Size and Forecast, By Application, 2015 – 2026 (US$ Million)
11.5.8. Latin America Market Size and Forecast, By End-users, 2015 – 2026 (US$ Million)
11.5.9. Brazil
11.5.9.1. Overview
11.5.9.2. Market Analysis, Forecast, and Y-O-Y Growth Rate, 2015 – 2026, (US$ Million)
11.5.10. Mexico
11.5.10.1. Overview
11.5.10.2. Market Analysis, Forecast, and Y-O-Y Growth Rate, 2015 – 2026, (US$ Million)
11.5.11. Argentina
11.5.11.1. Overview
11.5.11.2. Market Analysis, Forecast, and Y-O-Y Growth Rate, 2015 – 2026, (US$ Million)
11.5.12. Rest of LATAM
11.5.12.1. Overview
11.5.12.2. Market Analysis, Forecast, and Y-O-Y Growth Rate, 2015 – 2026, (US$ Million)
11.6. Middle East and Africa
11.6.1. Overview
11.6.2. Key Manufacturers in Middle East and Africa
11.6.3. Middle East and Africa Market Size and Forecast, By Country, 2015 – 2026 (US$ Million)
11.6.4. Middle East and Africa Market Size and Forecast, By Solution Type, 2015 – 2026 (US$ Million)
11.6.5. Middle East and Africa Market Size and Forecast, By Bag Type, 2015 – 2026 (US$ Million)
11.6.6. Middle East and Africa Market Size and Forecast, By Type, 2015 – 2026 (US$ Million)
11.6.7. Middle East and Africa Market Size and Forecast, By Application, 2015 – 2026 (US$ Million)
11.6.8. Middle East and Africa Market Size and Forecast, By End-users, 2015 – 2026 (US$ Million)
11.6.9. Saudi Arabia
11.6.9.1. Overview
11.6.9.2. Market Analysis, Forecast, and Y-O-Y Growth Rate, 2015 – 2026, (US$ Million)
11.6.10. United Arab Emirates
11.6.10.1. Overview
11.6.10.2. Market Analysis, Forecast, and Y-O-Y Growth Rate, 2015 – 2026, (US$ Million)
12. KEY VENDOR ANALYSIS
12.1. ICU Medical, Inc.
12.1.1. Company Snapshot
12.1.2. Financial Performance
12.1.3. Product Benchmarking
12.1.4. Strategic Initiatives
12.2. Baxter
12.3. B. Braun Melsungen Ag
12.4. Grifols, S.A.
12.5. Fresenius Kabi USA, LLC
12.6. Vifor Pharma Management Ltd
12.7. JW Life Science
12.8. Amanta Healthcare
12.9. Salius Pharma Private Limited
12.10. Axa Parenterals Ltd
13. 360 DEGREE ANALYSTVIEW
14. APPENDIX
14.1. Research Methodology
14.2. References
14.3. Abbreviations
14.4. Disclaimer
14.5. Contact Us
List of Tables
TABLE List of data sources
TABLE Market drivers; Impact Analysis
TABLE Market restraints; Impact Analysis
TABLE Intravenous solution market: Solution Type Snapshot (2019)
TABLE Segment Dashboard; Definition and Scope, by Solution Type
TABLE Global Intravenous solution market, by Solution Type 2015-2026 (USD Million)
TABLE Intravenous solution market: Bag Type Snapshot (2019)
TABLE Segment Dashboard; Definition and Scope, by Bag Type
TABLE Global Intravenous solution market, by Bag Type 2015-2026 (USD Million)
TABLE Intravenous solution market: Type Snapshot (2019)
TABLE Segment Dashboard; Definition and Scope, by Type
TABLE Global Intravenous solution market, by Type 2015-2026 (USD Million)
TABLE Intravenous solution market: Application Snapshot (2019)
TABLE Segment Dashboard; Definition and Scope, by Application
TABLE Global Intravenous solution market, by Application 2015-2026 (USD Million)
TABLE Intravenous solution market: Regional snapshot (2018)
TABLE Segment Dashboard; Definition and Scope, by Region
TABLE Global Intravenous solution market, by Region 2015-2026 (USD Million)
TABLE North America Intravenous solution market, by Country, 2015-2026 (USD Million)
TABLE North America Intravenous solution market, by Solution Type, 2015-2026 (USD Million)
TABLE North America Intravenous solution market, by Bag Type, 2015-2026 (USD Million)
TABLE North America Intravenous solution market, by Type, 2015-2026 (USD Million)
TABLE North America Intravenous solution market, by Application, 2015-2026 (USD Million)
TABLE Europe Intravenous solution market, by country, 2015-2026 (USD Million)
TABLE Europe Intravenous solution market, by Solution Type, 2015-2026 (USD Million)
TABLE Europe Intravenous solution market, by Bag Type, 2015-2026 (USD Million)
TABLE Europe Intravenous solution market, by Type, 2015-2026 (USD Million)
TABLE Europe Intravenous solution market, by Application, 2015-2026 (USD Million)
TABLE Asia Pacific Intravenous solution market, by country, 2015-2026 (USD Million)
TABLE Asia Pacific Intravenous solution market, by Solution Type, 2015-2026 (USD Million)
TABLE Asia Pacific Intravenous solution market, by Bag Type, 2015-2026 (USD Million)
TABLE Asia Pacific Intravenous solution market, by Type, 2015-2026 (USD Million)
TABLE Asia Pacific Intravenous solution market, by Application, 2015-2026 (USD Million)
TABLE Latin America Intravenous solution market, by country, 2015-2026 (USD Million)
TABLE Latin America Intravenous solution market, by Solution Type, 2015-2026 (USD Million)
TABLE Latin America Intravenous solution market, by Bag Type, 2015-2026 (USD Million)
TABLE Latin America Intravenous solution market, by Type, 2015-2026 (USD Million)
TABLE Latin America Intravenous solution market, by Application, 2015-2026 (USD Million)
TABLE Middle East and Africa Intravenous solution market, by country, 2015-2026 (USD Million)
TABLE Middle East and Africa Intravenous solution market, by Solution Type, 2015-2026 (USD Million)
TABLE Middle East and Africa Intravenous solution market, by Bag Type, 2015-2026 (USD Million)
TABLE Middle East and Africa Intravenous solution market, by Type, 2015-2026 (USD Million)
TABLE Middle East and Africa Intravenous solution market, by Application, 2015-2026 (USD Million)
List of Figures
FIGURE Intravenous solution market segmentation
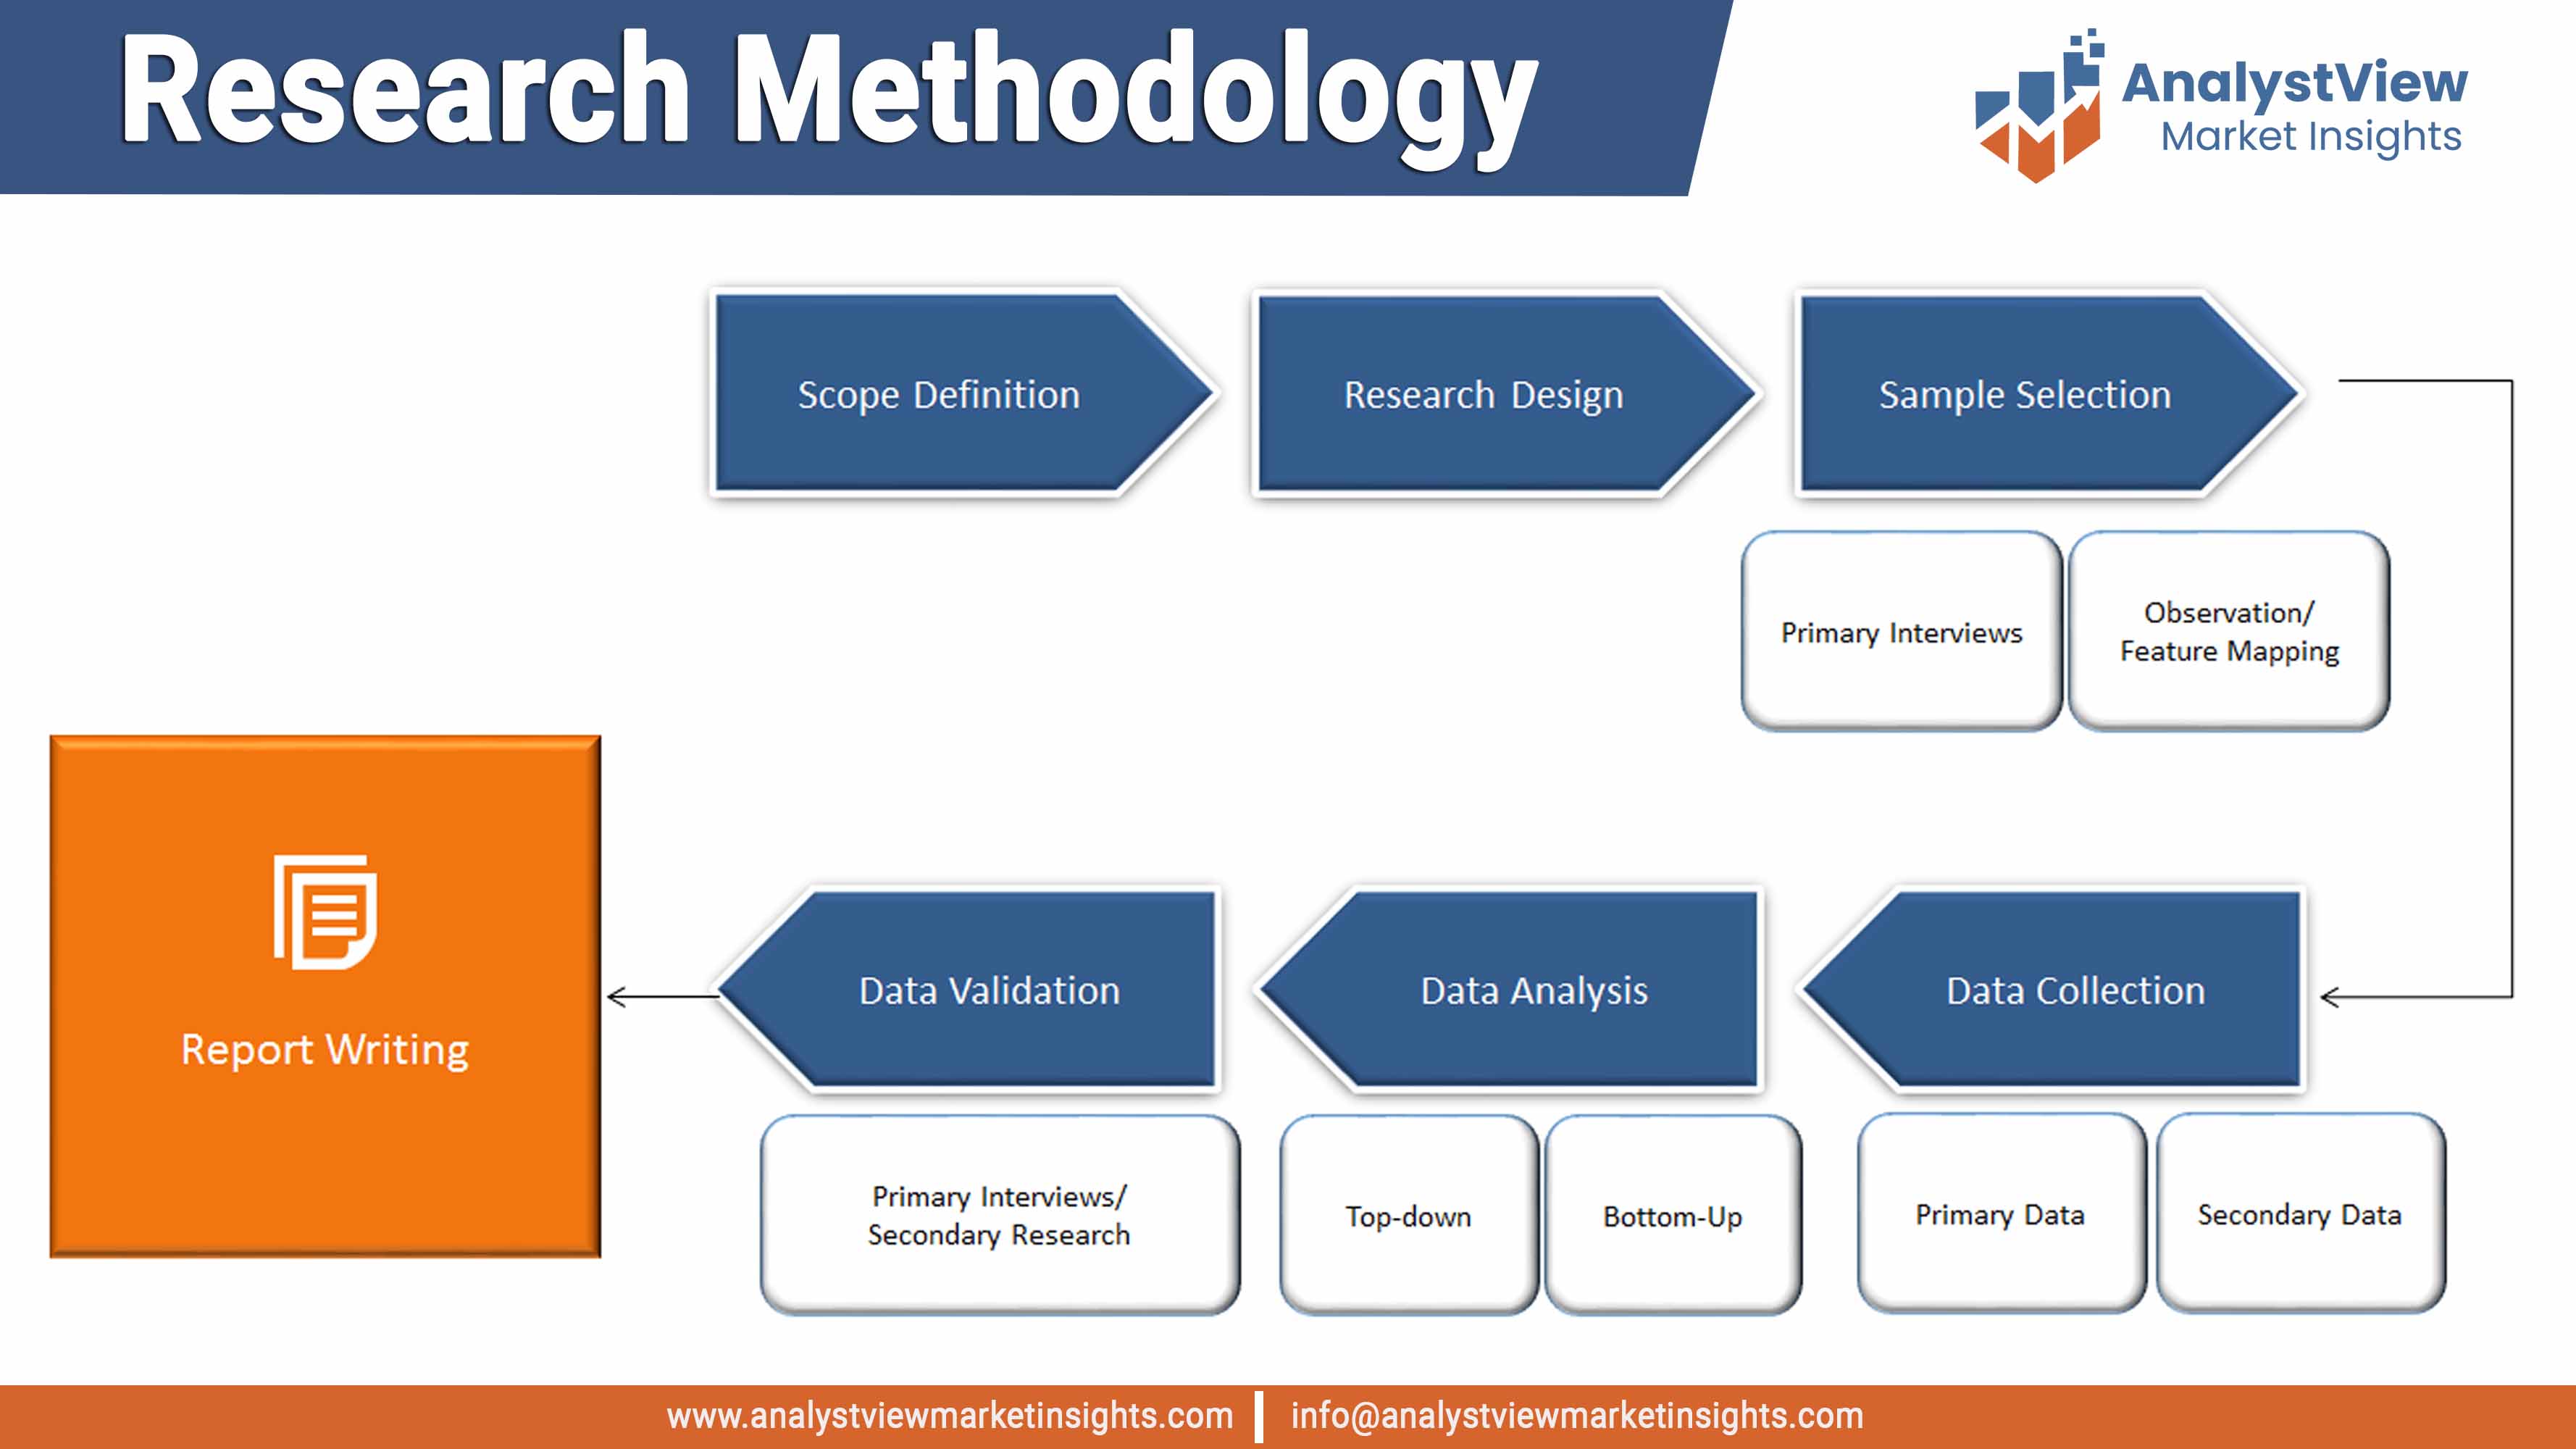
FIGURE Market research methodology
FIGURE Value chain analysis
FIGURE Porter’s Five Forces Analysis
FIGURE Market Attractiveness Analysis
FIGURE Competitive Landscape; Key company market share analysis, 2018
FIGURE Solution Type segment market share analysis, 2019 & 2026
FIGURE Solution Type segment market size forecast and trend analysis, 2015 to 2026 (USD Million)
FIGURE Saline market size forecast and trend analysis, 2015 to 2026 (USD Million)
FIGURE Dextran market size forecast and trend analysis, 2015 to 2026 (USD Million)
FIGURE Lactated Ringer’s market size forecast and trend analysis, 2015 to 2026 (USD Million)
FIGURE Amino Acid market size forecast and trend analysis, 2015 to 2026 (USD Million)
FIGURE Vitamins & Minerals market size forecast and trend analysis, 2015 to 2026 (USD Million)
FIGURE Heparin and Trace Elements market size forecast and trend analysis, 2015 to 2026 (USD Million)
FIGURE Mixed Solutions market size forecast and trend analysis, 2015 to 2026 (USD Million)
FIGURE Bag Type segment market share analysis, 2019 & 2026
FIGURE Bag Type segment market size forecast and trend analysis, 2015 to 2026 (USD Million)
FIGURE Large Volume Bags (greater than 250ml) market size forecast and trend analysis, 2015 to 2026 (USD Million)
FIGURE Small Volume Bags (less than 250ml) market size forecast and trend analysis, 2015 to 2026 (USD Million)
FIGURE Type segment market share analysis, 2019 & 2026
FIGURE Type segment market size forecast and trend analysis, 2015 to 2026 (USD Million)
FIGURE Peripheral Parenteral Nutrition market size forecast and trend analysis, 2015 to 2026 (USD Million)
FIGURE Total Parenteral Nutrition market size forecast and trend analysis, 2015 to 2026 (USD Million)
FIGURE Application segment market share analysis, 2019 & 2026
FIGURE Application segment market size forecast and trend analysis, 2015 to 2026 (USD Million)
FIGURE Basic IV Solution market size forecast and trend analysis, 2015 to 2026 (USD Million)
FIGURE Nutritional IV Solution market size forecast and trend analysis, 2015 to 2026 (USD Million)
FIGURE Blood IV Solution market size forecast and trend analysis, 2015 to 2026 (USD Million)
FIGURE Drug IV Solution market size forecast and trend analysis, 2015 to 2026 (USD Million)
FIGURE Irrigation IV Solution market size forecast and trend analysis, 2015 to 2026 (USD Million)
FIGURE End Users segment market share analysis, 2019 & 2026
FIGURE End Users segment market size forecast and trend analysis, 2015 to 2026 (USD Million)
FIGURE Hospital & Clinics market size forecast and trend analysis, 2015 to 2026 (USD Million)
FIGURE Ambulatory market size forecast and trend analysis, 2015 to 2026 (USD Million)
FIGURE Home Care market size forecast and trend analysis, 2015 to 2026 (USD Million)
FIGURE Regional segment market share analysis, 2019 & 2026
FIGURE Regional segment market size forecast and trend analysis, 2015 to 2026 (USD Million)
FIGURE North America Intravenous solution market share and leading players, 2018
FIGURE Europe Intravenous solution market share and leading players, 2018
FIGURE Asia Pacific Intravenous solution market share and leading players, 2018
FIGURE Latin America Intravenous solution market share and leading players, 2018
FIGURE Middle East and Africa Intravenous solution market share and leading players, 2018
FIGURE North America Intravenous solution market share analysis by country, 2018
FIGURE U.S. Intravenous solution market size, forecast and trend analysis, 2015 to 2026 (USD Million)
FIGURE Canada Intravenous solution market size, forecast and trend analysis, 2015 to 2026 (USD Million)
FIGURE Europe Intravenous solution market share analysis by country, 2018
FIGURE Germany Intravenous solution market size, forecast and trend analysis, 2015 to 2026 (USD Million)
FIGURE Spain Intravenous solution market size, forecast and trend analysis, 2015 to 2026 (USD Million)
FIGURE Italy Intravenous solution market size, forecast and trend analysis, 2015 to 2026 (USD Million)
FIGURE UK Intravenous solution market size, forecast and trend analysis, 2015 to 2026 (USD Million)
FIGURE France Intravenous solution market size, forecast and trend analysis, 2015 to 2026 (USD Million)
FIGURE Rest of the Europe Intravenous solution market size, forecast and trend analysis, 2015 to 2026 (USD Million)
FIGURE Asia Pacific Intravenous solution market share analysis by country, 2018
FIGURE India Intravenous solution market size, forecast and trend analysis, 2015 to 2026 (USD Million)
FIGURE China Intravenous solution market size, forecast and trend analysis, 2015 to 2026 (USD Million)
FIGURE Japan Intravenous solution market size, forecast and trend analysis, 2015 to 2026 (USD Million)
FIGURE South Korea Intravenous solution market size, forecast and trend analysis, 2015 to 2026 (USD Million)
FIGURE Singapore Intravenous solution market size, forecast and trend analysis, 2015 to 2026 (USD Million)
FIGURE Rest of APAC Intravenous solution market size, forecast and trend analysis, 2015 to 2026 (USD Million)
FIGURE Latin America Intravenous solution market size, forecast and trend analysis, 2015 to 2026 (USD Million)
FIGURE Latin America Intravenous solution market share analysis by country, 2018
FIGURE Brazil Intravenous solution market size, forecast and trend analysis, 2015 to 2026 (USD Million)
FIGURE Mexico Intravenous solution market size, forecast and trend analysis, 2015 to 2026 (USD Million)
FIGURE Argentina Intravenous solution market size, forecast and trend analysis, 2015 to 2026 (USD Million)
FIGURE Rest of LATAM Intravenous solution market size, forecast and trend analysis, 2015 to 2026 (USD Million)
FIGURE Middle East and Africa Intravenous solution market size, forecast and trend analysis, 2015 to 2026 (USD Million)
FIGURE Middle East and Africa Intravenous solution market share analysis by country, 2018
FIGURE Saudi Arabia Intravenous solution market size, forecast and trend analysis, 2015 to 2026 (USD Million)
FIGURE United Arab Emirates Intravenous solution market size, forecast and trend analysis, 2015 to 2026 (USD Million)
