3D Bioprinting Market, Market by Technology (Magnetic Levitation, Inkjet-based, Syringe-based, and Laser-based), By Application (Medical, Dental, Biosensors, Bioinks) and Geography (North America, Europe, Asia Pacific, Latin America and Middle East and Africa) Analysis, Share, Trends, Size, & Forecast from 2019 2025
Report Code: AV352
Industry: Semiconductor and Electronics
Publiced On: 2020-12-01
Pages: 162
Format:


REPORT HIGHLIGHT
3D Bioprinting Market was valued at USD 898.9 million by 2018, growing with 17.2% CAGR during the forecast period, 2019-2025.
Market Dynamics
3D bioprinting is a method to induce cells, growth factors and other biotechnology practices in a way that mimics real tissue traits and functionality. In essence, 3D bioprinting works using the same principle of digital 3D printing. Material like Bioink is used to create a layer by layer structure of the cell or material that needs to be modeled. Article published in News Medical Life Sciences website, (Nov 2019), stated that researchers in the Rensselaer Polytechnic Institute have found a way to print living skin with blood vessels. The implications of such a ground-breaking discover can profound.
3D bioprinting is used extensively in research and development procedures. There is a marked increase in healthcare procedures globally. Based on data published in the American Medical Association (March 2019), health care spending costs in the US saw a rise to 3.9%. Factors such as a rise in chronic illnesses, spike in donor requirement and improvement in technological advancements are reasons that boost the demand for 3D bioprinting technology is only about to witness significant growth. All in all, the increase in the general aging population furthers the cause of this 3D bioprinting technology.
Technology Takeaway
Based on technology, the segmentation for the 3D bioprinting market can be classified into magnetic levitation, laser-based, inkjet-based, and syringe-based. Due to a constant rise in the research and development in biotechnology, the syringe category dominates the market. This segment holds the largest market share, however, in terms of the fastest-growing segment the magnetic levitation segment promises untapped potential. Based on data published on the NASA website, (March 2019), magnetic levitation will present scope for “Formative” bio fabrication using 3D bioprinting.
Several biotechnological advances such as muscle printing, human cell regeneration, and toxicity screening are all end-use categories where 3D bioprinting is applicable. Using 3D printing, the rate of failures is due to organ rejection by the recipient may go down significantly. Better precision as a result of 3D bioprinting leads to much more accurate results.
Application Takeaway
The 3D bioprinting market is divided into the following application-wise into medical, dental, biosensors, and bio-inks. Within the medical segment, the market is divided into organ penetration, implants and prosthetics, and medical pills. An article on Genengnews.com (September 2019) states, 3D modeling of complex vascular systems is possible using highly compatible bioinks and can be used for the treatment of vascular illnesses, which account for 17 million deaths per year.
Medical pills are also expected to witness a faster growth pace in the forecasted period. The need for effective medications that are more cost-effective and potent will lead to a rise in this segment. The drug Spritam that is produced by 3D printing is the first of its kind that is known to be beneficial for epileptic patients has been received by the USFDA for approval.
 Regional Takeaway
North America is the key player in this category. It dominates the market and is expected to grow consistently over the forecasted period. Some of the other reasons that will speed up the growth trajectory of this 3 D bioprinting market is the high disposable income in this category along with better healthcare infrastructure gives better room for the developing and thriving of this market.
China is also an upcoming market in the 3D bioprinting segment. An article in the Economic Times, (Sept 2019) stated that the University of Wollongong (UOW) has collaborated with Andhra Pradesh Medtech Zone (APMZ) to get in the bioprinting expertise in India. Initiatives such as these will only escalate the industry potential further.
Key Vendor Takeaway
Some of the key players in this segment include Organovo Holding, Cyfuse Biomedical K.K Inc.; TeVido BioDevices LLC; Luxexcel Group B.V.; Aspect Biosystems Ltd.; Stratasys Ltd.; Voxeljet A.G.; Bio3D Technologies Pte. Ltd.; 3Dynamics Systems Ltd.; Materialise N.V.; Solidscape, Inc. (acquired by Prodways Group) and Envision TEC.
The company Organovo has partnered with L’oreal for research and development purposes for research in skin tissue development. Another article published on News Medical net website stated that Regemat3D and Biogelx have announced that they would be collaborating and carrying out distribution activities for offering complete bioprinting solutions.
The market size and forecast for each segment and sub-segments has been considered as below:
- Historical Year – 2014 & 2016
- Base Year – 2018
- Estimated Year – 2019
- Projected Year – 2025
TARGET AUDIENCE
- Traders, Distributors, and Suppliers
- Manufacturers
- Government and Regional Agencies
- Research Organizations
- Consultants
- Distributors
SCOPE OF THE REPORT
The scope of this report covers the market by its major segments, which include as follows:
KEY PLAYERS
- Organovo Holding Inc.
- Cyfuse Biomedical
- BioBots
- Luxexcel Group BV
- TeVido BioDevices
- Aspect Biosystems
- 3Dynamics Systems
- Stratasys Ltd.
- Voxeljet
- Oceanz
- Materialise NV
- Envision TEC
- Bio3D Technologies
- Solidscape
MARKET, BY TECHNOLOGY
- Magnetic Levitation
- Inkjet based 3D bioprinting
- Laser based 3D bioprinting
- Syringe based 3D bioprinting
- Others
MARKET, BY APPLICATION
- Medical
- Biosensors
- Dental
- Bioinks
- Consumer/Personal product testing
- Food and animal product
- Others
MARKET, BY REGION
- North America
- U.S.
- Canada
- Europe
- Germany
- France
- Italy
- Spain
- United Kingdom
- Rest of Europe
- Asia Pacific
- India
- China
- South Korea
- Japan
- Singapore
- Rest of APAC
- Latin America
- Brazil
- Mexico
- Argentina
- Rest of LATAM
- Middle East and Africa
- Saudi Arabia
- United Arab Emirates
- Rest of MEA
TABLE OF CONTENT
1.3D BIOPRINTING MARKET OVERVIEW
1.1.Study Scope
1.2.Assumption and Methodology
2.EXECUTIVE SUMMARY
2.1.Market Snippet
2.1.1.Market Snippet by Technology
2.1.2.Market Snippet by Application
2.1.3.Market Snippet by Region
2.2.Competitive Insights
3.3D BIOPRINTING KEY MARKET TRENDS
3.1.Market Drivers
3.1.1.Impact Analysis of Market Drivers
3.2.Market Restraints
3.2.1.Impact Analysis of Market Restraints
3.3.Market Opportunities
3.4.Market Future Trends
4.3D BIOPRINTING INDUSTRY STUDY
4.1.Porter’s Five Forces Analysis
4.2.Marketing Strategy Analysis
4.3.Growth Prospect Mapping
4.4.Regulatory Framework Analysis
5.3D BIOPRINTING MARKET LANDSCAPE
5.1.Market Share Analysis
5.2.Key Innovators
5.3.Breakdown Data, by Key manufacturer
5.3.1.Established Player Analysis
5.3.2.Emerging Player Analysis
6.3D BIOPRINTING MARKET – BY TECHNOLOGY
6.1.Overview
6.1.1.Segment Share Analysis, By Technology, 2018 & 2025 (%)
6.2.Magnetic Levitation
6.2.1.Overview
6.2.2.Market Analysis, Forecast, and Y-O-Y Growth Rate, 2014 – 2025, (US$ Million)
6.3.Inkjet based 3D Bioprinting
6.3.1.Overview
6.3.2.Market Analysis, Forecast, and Y-O-Y Growth Rate, 2014 – 2025, (US$ Million)
6.4.Laser based 3D Bioprinting
6.4.1.Overview
6.4.2.Market Analysis, Forecast, and Y-O-Y Growth Rate, 2014 – 2025, (US$ Million)
6.5.Syringe based 3D Bioprinting
6.5.1.Overview
6.5.2.Market Analysis, Forecast, and Y-O-Y Growth Rate, 2014 – 2025, (US$ Million)
6.6.Others
6.6.1.Overview
6.6.2.Market Analysis, Forecast, and Y-O-Y Growth Rate, 2014 – 2025, (US$ Million)
7.3D BIOPRINTING MARKET – BY APPLICATION
7.1.Overview
7.1.1.Segment Share Analysis, By Application, 2018 & 2025 (%)
7.2.Medical
7.2.1.Overview
7.2.2.Market Analysis, Forecast, and Y-O-Y Growth Rate, 2014 – 2025, (US$ Million)
7.3.Biosensors
7.3.1.Overview
7.3.2.Market Analysis, Forecast, and Y-O-Y Growth Rate, 2014 – 2025, (US$ Million)
7.4.Dental
7.4.1.Overview
7.4.2.Market Analysis, Forecast, and Y-O-Y Growth Rate, 2014 – 2025, (US$ Million)
7.5.Bioinks
7.5.1.Overview
7.5.2.Market Analysis, Forecast, and Y-O-Y Growth Rate, 2014 – 2025, (US$ Million)
7.6.Consumer/Personal product testing
7.6.1.Overview
7.6.2.Market Analysis, Forecast, and Y-O-Y Growth Rate, 2014 – 2025, (US$ Million)
7.7.Food and animal product
7.7.1.Overview
7.7.2.Market Analysis, Forecast, and Y-O-Y Growth Rate, 2014 – 2025, (US$ Million)
7.8.Others
7.8.1.Overview
7.8.2.Market Analysis, Forecast, and Y-O-Y Growth Rate, 2014 – 2025, (US$ Million)
8.3D BIOPRINTING MARKET– BY GEOGRAPHY
8.1.Introduction
8.1.1.Segment Share Analysis, By Region, 2018 & 2025 (%)
8.2.North America
8.2.1.Overview
8.2.2.Key Manufacturers in North America
8.2.3.North America Market Size and Forecast, By Country, 2014 – 2025 (US$ Million)
8.2.4.North America Market Size and Forecast, By Technology, 2014 – 2025 (US$ Million)
8.2.5.North America Market Size and Forecast, By Application, 2014 – 2025 (US$ Million)
8.2.6.U.S.
8.2.6.1.Overview
8.2.6.2.Market Analysis, Forecast, and Y-O-Y Growth Rate, 2014 – 2025, (US$ Million)
8.2.7.Canada
8.2.7.1.Overview
8.2.7.2.Market Analysis, Forecast, and Y-O-Y Growth Rate, 2014 – 2025, (US$ Million)
8.3.Europe
8.3.1.Overview
8.3.2.Key Manufacturers in Europe
8.3.3.Europe Market Size and Forecast, By Country, 2014 – 2025 (US$ Million)
8.3.4.Europe Market Size and Forecast, By Technology, 2014 – 2025 (US$ Million)
8.3.5.Europe Market Size and Forecast, By Application, 2014 – 2025 (US$ Million)
8.3.6.Germany
8.3.6.1.Overview
8.3.6.2.Market Analysis, Forecast, and Y-O-Y Growth Rate, 2014 – 2025, (US$ Million)
8.3.7.Italy
8.3.7.1.Overview
8.3.7.2.Market Analysis, Forecast, and Y-O-Y Growth Rate, 2014 – 2025, (US$ Million)
8.3.8.United Kingdom
8.3.8.1.Overview
8.3.8.2.Market Analysis, Forecast, and Y-O-Y Growth Rate, 2014 – 2025, (US$ Million)
8.3.9.France
8.3.9.1.Overview
8.3.9.2.Market Analysis, Forecast, and Y-O-Y Growth Rate, 2014 – 2025, (US$ Million)
8.3.10.Rest of Europe
8.3.10.1.Overview
8.3.10.2.Market Analysis, Forecast, and Y-O-Y Growth Rate, 2014 – 2025, (US$ Million)
8.4.Asia Pacific (APAC)
8.4.1.Overview
8.4.2.Key Manufacturers in Asia Pacific
8.4.3.Asia Pacific Market Size and Forecast, By Country, 2014 – 2025 (US$ Million)
8.4.4.Asia Pacific Market Size and Forecast, By Technology, 2014 – 2025 (US$ Million)
8.4.5.Asia Pacific Market Size and Forecast, By Application, 2014 – 2025 (US$ Million)
8.4.6.India
8.4.6.1.Overview
8.4.6.2.Market Analysis, Forecast, and Y-O-Y Growth Rate, 2014 – 2025, (US$ Million)
8.4.7.China
8.4.7.1.Overview
8.4.7.2.Market Analysis, Forecast, and Y-O-Y Growth Rate, 2014 – 2025, (US$ Million)
8.4.8.Japan
8.4.8.1.Overview
8.4.8.2.Market Analysis, Forecast, and Y-O-Y Growth Rate, 2014 – 2025, (US$ Million)
8.4.9.South Korea
8.4.9.1.Overview
8.4.9.2.Market Analysis, Forecast, and Y-O-Y Growth Rate, 2014 – 2025, (US$ Million)
8.4.10.Rest of APAC
8.4.10.1.Overview
8.4.10.2.Market Analysis, Forecast, and Y-O-Y Growth Rate, 2014 – 2025, (US$ Million)
8.5.Latin America
8.5.1.Overview
8.5.2.Key Manufacturers in Latin America
8.5.3.Latin America Market Size and Forecast, By Country, 2014 – 2025 (US$ Million)
8.5.4.Latin America Market Size and Forecast, By Technology, 2014 – 2025 (US$ Million)
8.5.5.Latin America Market Size and Forecast, By Application, 2014 – 2025 (US$ Million)
8.5.6.Brazil
8.5.6.1.Overview
8.5.6.2.Market Analysis, Forecast, and Y-O-Y Growth Rate, 2014 – 2025, (US$ Million)
8.5.7.Mexico
8.5.7.1.Overview
8.5.7.2.Market Analysis, Forecast, and Y-O-Y Growth Rate, 2014 – 2025, (US$ Million)
8.5.8.Argentina
8.5.8.1.Overview
8.5.8.2.Market Analysis, Forecast, and Y-O-Y Growth Rate, 2014 – 2025, (US$ Million)
8.5.9.Rest of LATAM
8.5.9.1.Overview
8.5.9.2.Market Analysis, Forecast, and Y-O-Y Growth Rate, 2014 – 2025, (US$ Million)
8.6.Middle East and Africa
8.6.1.Overview
8.6.2.Key Manufacturers in Middle East and Africa
8.6.3.Middle East and Africa Market Size and Forecast, By Country, 2014 – 2025 (US$ Million)
8.6.4.Middle East and Africa Market Size and Forecast, By Technology, 2014 – 2025 (US$ Million)
8.6.5.Middle East and Africa Market Size and Forecast, By Application, 2014 – 2025 (US$ Million)
8.6.6.Saudi Arabia
8.6.6.1.Overview
8.6.6.2.Market Analysis, Forecast, and Y-O-Y Growth Rate, 2014 – 2025, (US$ Million)
8.6.7.United Arab Emirates
8.6.7.1.Overview
8.6.7.2.Market Analysis, Forecast, and Y-O-Y Growth Rate, 2014 – 2025, (US$ Million)
9.KEY VENDOR ANALYSIS
9.1.Organovo Holding Inc.
9.1.1.Company Snapshot
9.1.2.Financial Performance
9.1.3.Product Benchmarking
9.1.4.Strategic Initiatives
9.2.Cyfuse Biomedical
9.3.BioBots
9.4.Luxexcel Group BV
9.5.TeVido BioDevices
9.6.Aspect Biosystems
9.7.3Dynamics Systems
9.8.Stratasys Ltd.
9.9.Voxeljet
9.10.Oceanz
9.11.Materialise NV
9.12.Envision TEC
9.13.Bio3D Technologies
9.14.Solidscape
10.360 DEGREE ANALYSTVIEW
11.APPENDIX
11.1.Research Methodology
11.2.References
11.3.Abbreviations
11.4.Disclaimer
11.5.Contact Us
List of Tables
TABLE List of data sources
TABLE Market drivers; Impact Analysis
TABLE Market restraints; Impact Analysis
TABLE 3D Bioprinting market: Technology snapshot (2018)
TABLE Segment Dashboard; Definition and Scope, by Technology
TABLE Global 3D Bioprinting market, by Technology 2014-2025 (USD Million)
TABLE 3D Bioprinting market: Application snapshot (2018)
TABLE Segment Dashboard; Definition and Scope, by Application
TABLE Global 3D Bioprinting market, by Application 2014-2025 (USD Million)
TABLE 3D Bioprinting market: Regional snapshot (2018)
TABLE Segment Dashboard; Definition and Scope, by Region
TABLE Global 3D Bioprinting market, by Region 2014-2025 (USD Million)
TABLE North America 3D Bioprinting market, by Country, 2014-2025 (USD Million)
TABLE North America 3D Bioprinting market, by Technology, 2014-2025 (USD Million)
TABLE North America 3D Bioprinting market, by Application, 2014-2025 (USD Million)
TABLE Europe 3D Bioprinting market, by country, 2014-2025 (USD Million)
TABLE Europe 3D Bioprinting market, by Technology, 2014-2025 (USD Million)
TABLE Europe 3D Bioprinting market, by Application, 2014-2025 (USD Million)
TABLE Asia Pacific 3D Bioprinting market, by country, 2014-2025 (USD Million)
TABLE Asia Pacific 3D Bioprinting market, by Technology, 2014-2025 (USD Million)
TABLE Asia Pacific 3D Bioprinting market, by Application, 2014-2025 (USD Million)
TABLE Latin America 3D Bioprinting market, by country, 2014-2025 (USD Million)
TABLE Latin America 3D Bioprinting market, by Technology, 2014-2025 (USD Million)
TABLE Latin America 3D Bioprinting market, by Application, 2014-2025 (USD Million)
TABLE Middle East and Africa 3D Bioprinting market, by country, 2014-2025 (USD Million)
TABLE Middle East and Africa 3D Bioprinting market, by Technology, 2014-2025 (USD Million)
TABLE Middle East and Africa 3D Bioprinting market, by Application, 2014-2025 (USD Million)
List of Figures
FIGURE 3D Bioprinting market segmentation
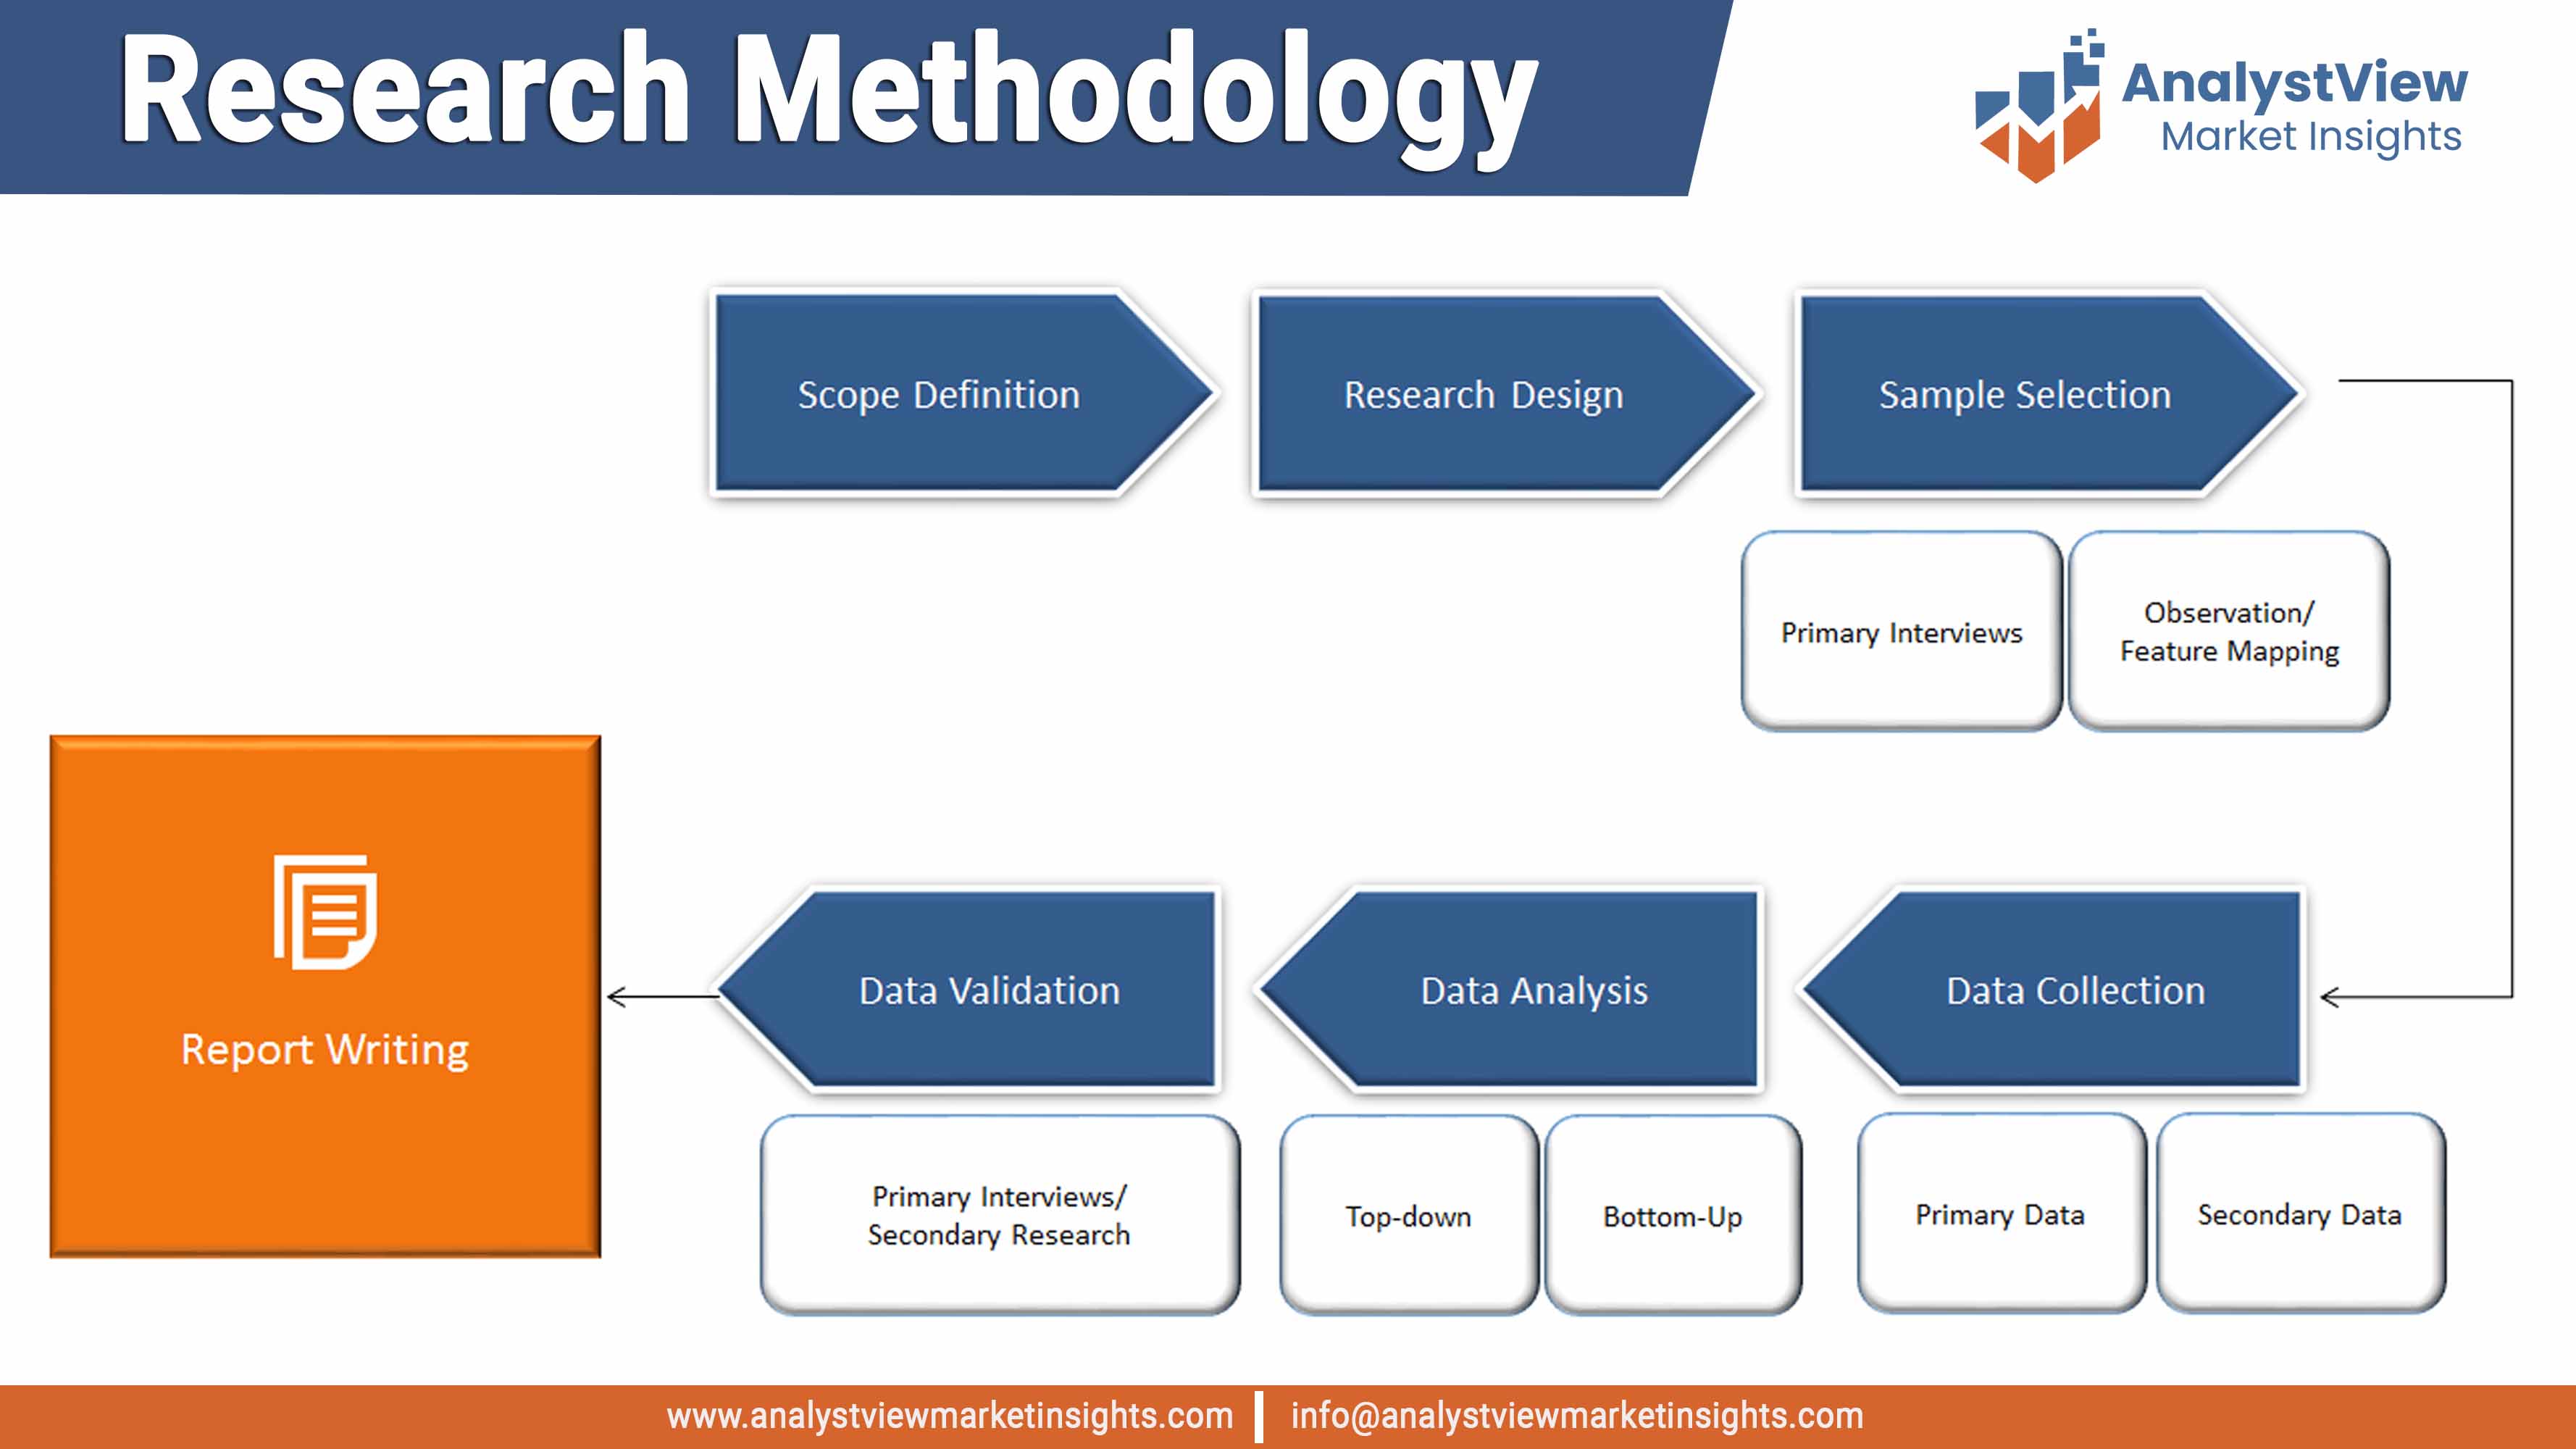
FIGURE Market research methodology
FIGURE Value chain analysis
FIGURE Porter’s Five Forces Analysis
FIGURE Market Attractiveness Analysis
FIGURE Competitive Landscape; Key company market share analysis, 2018
FIGURE Technology segment market share analysis, 2018 & 2025
FIGURE Technology segment market size forecast and trend analysis, 2014 to 2025 (USD Million)
FIGURE Magnetic Levitation market size forecast and trend analysis, 2014 to 2025 (USD Million)
FIGURE Inkjet based 3D bioprinting market size forecast and trend analysis, 2014 to 2025 (USD Million)
FIGURE Laser based 3D bioprinting market size forecast and trend analysis, 2014 to 2025 (USD Million)
FIGURE Syringe based 3D bioprinting market size forecast and trend analysis, 2014 to 2025 (USD Million)
FIGURE Others market size forecast and trend analysis, 2014 to 2025 (USD Million)
FIGURE Application segment market share analysis, 2018 & 2025
FIGURE Application segment market size forecast and trend analysis, 2014 to 2025 (USD Million)
FIGURE Medical market size forecast and trend analysis, 2014 to 2025 (USD Million)
FIGURE Biosensors market size forecast and trend analysis, 2014 to 2025 (USD Million)
FIGURE Dental market size forecast and trend analysis, 2014 to 2025 (USD Million)
FIGURE Bioinks market size forecast and trend analysis, 2014 to 2025 (USD Million)
FIGURE Consumer/Personal product testing market size forecast and trend analysis, 2014 to 2025 (USD Million)
FIGURE Food and animal product market size forecast and trend analysis, 2014 to 2025 (USD Million)
FIGURE Others market size forecast and trend analysis, 2014 to 2025 (USD Million)
FIGURE Regional segment market share analysis, 2018 & 2025
FIGURE Regional segment market size forecast and trend analysis, 2014 to 2025 (USD Million)
FIGURE North America 3D Bioprinting market share and leading players, 2018
FIGURE Europe 3D Bioprinting market share and leading players, 2018
FIGURE Asia Pacific 3D Bioprinting market share and leading players, 2018
FIGURE Latin America 3D Bioprinting market share and leading players, 2018
FIGURE Middle East and Africa 3D Bioprinting market share and leading players, 2018
FIGURE North America 3D Bioprinting market share analysis by country, 2018
FIGURE U.S. 3D Bioprinting market size, forecast and trend analysis, 2014 to 2025 (USD Million)
FIGURE Canada 3D Bioprinting market size, forecast and trend analysis, 2014 to 2025 (USD Million)
FIGURE Europe 3D Bioprinting market share analysis by country, 2018
FIGURE Germany 3D Bioprinting market size, forecast and trend analysis, 2014 to 2025 (USD Million)
FIGURE Spain 3D Bioprinting market size, forecast and trend analysis, 2014 to 2025 (USD Million)
FIGURE Italy 3D Bioprinting market size, forecast and trend analysis, 2014 to 2025 (USD Million)
FIGURE UK 3D Bioprinting market size, forecast and trend analysis, 2014 to 2025 (USD Million)
FIGURE France 3D Bioprinting market size, forecast and trend analysis, 2014 to 2025 (USD Million)
FIGURE Rest of the Europe 3D Bioprinting market size, forecast and trend analysis, 2014 to 2025 (USD Million)
FIGURE Asia Pacific 3D Bioprinting market share analysis by country, 2018
FIGURE India 3D Bioprinting market size, forecast and trend analysis, 2014 to 2025 (USD Million)
FIGURE China 3D Bioprinting market size, forecast and trend analysis, 2014 to 2025 (USD Million)
FIGURE Japan 3D Bioprinting market size, forecast and trend analysis, 2014 to 2025 (USD Million)
FIGURE South Korea 3D Bioprinting market size, forecast and trend analysis, 2014 to 2025 (USD Million)
FIGURE Singapore 3D Bioprinting market size, forecast and trend analysis, 2014 to 2025 (USD Million)
FIGURE Rest of APAC 3D Bioprinting market size, forecast and trend analysis, 2014 to 2025 (USD Million)
FIGURE Latin America 3D Bioprinting market size, forecast and trend analysis, 2014 to 2025 (USD Million)
FIGURE Latin America 3D Bioprinting market share analysis by country, 2018
FIGURE Brazil 3D Bioprinting market size, forecast and trend analysis, 2014 to 2025 (USD Million)
FIGURE Mexico 3D Bioprinting market size, forecast and trend analysis, 2014 to 2025 (USD Million)
FIGURE Argentina 3D Bioprinting market size, forecast and trend analysis, 2014 to 2025 (USD Million)
FIGURE Rest of LATAM 3D Bioprinting market size, forecast and trend analysis, 2014 to 2025 (USD Million)
FIGURE Middle East and Africa 3D Bioprinting market size, forecast and trend analysis, 2014 to 2025 (USD Million)
FIGURE Middle East and Africa 3D Bioprinting market share analysis by country, 2018
FIGURE Saudi Arabia 3D Bioprinting market size, forecast and trend analysis, 2014 to 2025 (USD Million)
FIGURE United Arab Emirates 3D Bioprinting market size, forecast and trend analysis, 2014 to 2025 (USD Million)
