Advanced Energy Systems Market, By Technology (Flywheel, Batteries, Compressed Air, Thermal, and Molten Salt) andGeography (North America, Europe, Asia Pacific, Middle East & Africa, and Latin America) Analysis, Share, Trends, Size, & Forecast from 2019 2025
Report Code: AV445
Industry: Semiconductor and Electronics
Publiced On: 2020-11-01
Pages: 140
Format:


REPORT HIGHLIGHT
Advanced Energy Systems market was valued at USD 2.33 billion by 2018, growing with 7.3% CAGR during the forecast period, 2019-2025.
Market Dynamics
The global energy consumption has witnessed a drastic rise in the past decade. Electricity is used in several devices in our day-to-day life. The constant increase in global population has led to a massive demand for energy. The paradigm shifts from use of conventional energy generation sources to renewable energy sources have created a subsequent demand for advanced energy storage systems. Increasing efforts taken by government as well as public organizations towards minimizing greenhouse gas (GHG) emissions have created a huge potential for growth of the global advanced energy storage market. Additionally, technological advancements such as high-caliber batteries and efficient storage systems will emerge in favor of market growth.
The growing use of renewable energy has led to the deployment of several advanced energy storage systems, subsequently creating a huge product demand. Furthermore, the increasing adoption of plug-in electric vehicles will constitute an increase in the global advanced energy storage systems market size in the coming years. The advent of several new solid-state batteries, coupled with lithium and lead-acid batteries, has laid the foundation for market growth. Innovative products such as low self-discharge time and enhanced operations at higher temperatures will help companies generate substantial advanced energy storage market revenue in the forthcoming years.
The report offers insights into the latest advanced energy market trends. It highlights key products in the market and summarizes the impact that these products have had on the market. For a better user understanding, the market has been evaluated on several frontiers. The market is classified on the basis of various criteria, including technology and regional demographics.
Thermal Segment to Exhibit High Growth
In terms of technology, the market is divided into Flywheel, Batteries, Molten Salt, Thermal and Compressed Air. The thermal segment is likely to emerge dominant in the coming years, driven by numerous product applications. This segment accounted for a significant share of the advanced energy storage systems market share. The optimum product efficacies, coupled with their ability to store abundant energy will lead to increased adoption. The deployment of molten salt technology has allowed the possibilities of retaining thermal energy within less time.
Besides thermal energy, the batteries segment is likely to grow considerably driven by recent product innovations. The advent of fast and easily chargeable batteries has created platforms for growth. The overall energy generated at solar farms can be concentrated and used to generate energy in unfavorable climatic conditions. The system can also be used to generate energy during night time, wherein there are no solar sources available. The growing incorporation of molten salt technology will contribute to the growth of this segment in the forthcoming years.
 Regional Takeaway
Based on regional demographics, the market is classified into North America, Europe, Latin America, Asia Pacific, and the Middle East and Africa. Based on extensive research analysis methods, the report labels the Asia Pacific as the region that will exhibit the highest growth rate among all regions. This is primarily attributable to the fact that this region caters to a wider consumer base and a subsequently high demand for advanced energy storage systems. The constantly rising population in emerging countries of Japan and China has also boded well for the growth of the market in the Asia Pacific. Favorable climatic conditions and government policies aimed at the deployment of solar energy harnessing will aid the growth of the market in the coming years.
Key Vendors Takeaway
Alevo, Exide Technologies, GE Healthcare, Active Power, Inc., Altair Nanotechnologies, Inc., AES Energy Storage, Ecoult Energy Storage Solutions, Enersys, Nippon Chemi-Con Corporation, China Bak Battery Inc., Energizer Holdings Inc., SAFT, Hitachi, Duke Energy are some of the key players operating in this market.
The market size and forecast for each segment and sub-segments has been considered as below:
- Historical Year – 2014 & 2016
- Base Year – 2018
- Estimated Year – 2019
- Projected Year – 2025
TARGET AUDIENCE
- Traders, Distributors, and Suppliers
- Manufacturers
- Government and Regional Agencies
- Research Organizations
- Consultants
- Distributors
SCOPE OF THE REPORT
The scope of this report covers the market by its major segments, which include as follows:
KEY COMPANIES
- GE Energy Storage
- China BAK Battery, Inc.
- A123 Systems, LLC.
- Greensmith
- Kokam Co. Ltd.
- Hitachi
- Energizer Holdings Inc.
- Duke Energy
- AES Energy
- The Furukawa Battery Co., Ltd.
- Samsung SDI
- Ecoult
- Alstom
- Enersys
- Alevo
- Electrovaya Inc.
- Toshiba
- ZBB Energy
- Exide Technologies
- Active Power Inc.
- LG Chem Ltd.
- Maxwell Technologies Inc.
- Nippon Chemi-Con Corporation
- SAFT Groupe
MARKET, BY TECHNOLOGY
- Flywheel
- Batteries
- Compressed Air
- Thermal
- Molten Salt
MARKET, BY REGION
- North America
- U.S.
- Canada
- Europe
- Germany
- France
- Italy
- Spain
- United Kingdom
- Rest of Europe
- Asia Pacific
- India
- China
- South Korea
- Japan
- Singapore
- Rest of APAC
- Latin America
- Brazil
- Mexico
- Argentina
- Rest of LATAM
- Middle East and Africa
- Saudi Arabia
- United Arab Emirates
- Rest of MEA
TABLE OF CONTENT
1.ADVANCED ENERGY SYSTEMS MARKET OVERVIEW
1.1.Study Scope
1.2.Assumption and Methodology
2.EXECUTIVE SUMMARY
2.1.Market Snippet
2.1.1.Market Snippet by Technology
2.1.2.Market Snippet by Region
2.2.Competitive Insights
3.ADVANCED ENERGY SYSTEMS KEY MARKET TRENDS
3.1.Market Drivers
3.1.1.Impact Analysis of Market Drivers
3.2.Market Restraints
3.2.1.Impact Analysis of Market Restraints
3.3.Market Opportunities
3.4.Market Future Trends
4.ADVANCED ENERGY SYSTEMS INDUSTRY STUDY
4.1.Porter’s Five Forces Analysis
4.2.Marketing Strategy Analysis
4.3.Growth Prospect Mapping
4.4.Regulatory Framework Analysis
5.ADVANCED ENERGY SYSTEMS MARKET LANDSCAPE
5.1.Market Share Analysis
5.2.Key Innovators
5.3.Breakdown Data, by Key manufacturer
5.3.1.Established Player Analysis
5.3.2.Emerging Player Analysis
6.ADVANCED ENERGY SYSTEMS MARKET – BY TECHNOLOGY
6.1.Overview
6.1.1.Segment Share Analysis, By Technology, 2018 & 2025 (%)
6.2.Flywheel
6.2.1.Overview
6.2.2.Market Analysis, Forecast, and Y-O-Y Growth Rate, 2014 – 2025, (US$ Million)
6.3.Batteries
6.3.1.Overview
6.3.2.Market Analysis, Forecast, and Y-O-Y Growth Rate, 2014 – 2025, (US$ Million)
6.4.Compressed Air
6.4.1.Overview
6.4.2.Market Analysis, Forecast, and Y-O-Y Growth Rate, 2014 – 2025, (US$ Million)
6.5.Thermal
6.5.1.Overview
6.5.2.Market Analysis, Forecast, and Y-O-Y Growth Rate, 2014 – 2025, (US$ Million)
6.6.Molten Salt
6.6.1.Overview
6.6.2.Market Analysis, Forecast, and Y-O-Y Growth Rate, 2014 – 2025, (US$ Million)
7.ADVANCED ENERGY SYSTEMS MARKET– BY GEOGRAPHY
7.1.Introduction
7.1.1.Segment Share Analysis, By Region, 2018 & 2025 (%)
7.2.North America
7.2.1.Overview
7.2.2.Key Manufacturers in North America
7.2.3.North America Market Size and Forecast, By Country, 2014 – 2025 (US$ Million)
7.2.4.North America Market Size and Forecast, By Technology, 2014 – 2025 (US$ Million)
7.2.5.U.S.
7.2.5.1.Overview
7.2.5.2.Market Analysis, Forecast, and Y-O-Y Growth Rate, 2014 – 2025, (US$ Million)
7.2.6.Canada
7.2.6.1.Overview
7.2.6.2.Market Analysis, Forecast, and Y-O-Y Growth Rate, 2014 – 2025, (US$ Million)
7.3.Europe
7.3.1.Overview
7.3.2.Key Manufacturers in Europe
7.3.3.Europe Market Size and Forecast, By Country, 2014 – 2025 (US$ Million)
7.3.4.Europe Market Size and Forecast, By Technology, 2014 – 2025 (US$ Million)
7.3.5.Germany
7.3.5.1.Overview
7.3.5.2.Market Analysis, Forecast, and Y-O-Y Growth Rate, 2014 – 2025, (US$ Million)
7.3.6.Italy
7.3.6.1.Overview
7.3.6.2.Market Analysis, Forecast, and Y-O-Y Growth Rate, 2014 – 2025, (US$ Million)
7.3.7.United Kingdom
7.3.7.1.Overview
7.3.7.2.Market Analysis, Forecast, and Y-O-Y Growth Rate, 2014 – 2025, (US$ Million)
7.3.8.France
7.3.8.1.Overview
7.3.8.2.Market Analysis, Forecast, and Y-O-Y Growth Rate, 2014 – 2025, (US$ Million)
7.3.9.Rest of Europe
7.3.9.1.Overview
7.3.9.2.Market Analysis, Forecast, and Y-O-Y Growth Rate, 2014 – 2025, (US$ Million)
7.4.Asia Pacific (APAC)
7.4.1.Overview
7.4.2.Key Manufacturers in Asia Pacific
7.4.3.Asia Pacific Market Size and Forecast, By Country, 2014 – 2025 (US$ Million)
7.4.4.Asia Pacific Market Size and Forecast, By Technology, 2014 – 2025 (US$ Million)
7.4.5.India
7.4.5.1.Overview
7.4.5.2.Market Analysis, Forecast, and Y-O-Y Growth Rate, 2014 – 2025, (US$ Million)
7.4.6.China
7.4.6.1.Overview
7.4.6.2.Market Analysis, Forecast, and Y-O-Y Growth Rate, 2014 – 2025, (US$ Million)
7.4.7.Japan
7.4.7.1.Overview
7.4.7.2.Market Analysis, Forecast, and Y-O-Y Growth Rate, 2014 – 2025, (US$ Million)
7.4.8.South Korea
7.4.8.1.Overview
7.4.8.2.Market Analysis, Forecast, and Y-O-Y Growth Rate, 2014 – 2025, (US$ Million)
7.4.9.Rest of APAC
7.4.9.1.Overview
7.4.9.2.Market Analysis, Forecast, and Y-O-Y Growth Rate, 2014 – 2025, (US$ Million)
7.5.Latin America
7.5.1.Overview
7.5.2.Key Manufacturers in Latin America
7.5.3.Latin America Market Size and Forecast, By Country, 2014 – 2025 (US$ Million)
7.5.4.Latin America Market Size and Forecast, By Technology, 2014 – 2025 (US$ Million)
7.5.5.Brazil
7.5.5.1.Overview
7.5.5.2.Market Analysis, Forecast, and Y-O-Y Growth Rate, 2014 – 2025, (US$ Million)
7.5.6.Mexico
7.5.6.1.Overview
7.5.6.2.Market Analysis, Forecast, and Y-O-Y Growth Rate, 2014 – 2025, (US$ Million)
7.5.7.Argentina
7.5.7.1.Overview
7.5.7.2.Market Analysis, Forecast, and Y-O-Y Growth Rate, 2014 – 2025, (US$ Million)
7.5.8.Rest of LATAM
7.5.8.1.Overview
7.5.8.2.Market Analysis, Forecast, and Y-O-Y Growth Rate, 2014 – 2025, (US$ Million)
7.6.Middle East and Africa
7.6.1.Overview
7.6.2.Key Manufacturers in Middle East and Africa
7.6.3.Middle East and Africa Market Size and Forecast, By Country, 2014 – 2025 (US$ Million)
7.6.4.Middle East and Africa Market Size and Forecast, By Technology, 2014 – 2025 (US$ Million)
7.6.5.Saudi Arabia
7.6.5.1.Overview
7.6.5.2.Market Analysis, Forecast, and Y-O-Y Growth Rate, 2014 – 2025, (US$ Million)
7.6.6.United Arab Emirates
7.6.6.1.Overview
7.6.6.2.Market Analysis, Forecast, and Y-O-Y Growth Rate, 2014 – 2025, (US$ Million)
8.KEY VENDOR ANALYSIS
8.1.GE Healthcare
8.1.1.Company Snapshot
8.1.2.Financial Performance
8.1.3.Product Benchmarking
8.1.4.Strategic Initiatives
8.2.Alevo
8.3.AES Energy Storage
8.4.Active Power, Inc.
8.5.China Bak Battery Inc.
8.6.Ecoult Energy Storage Solutions
8.7.Altair Nanotechnologies Inc
8.8.Energizer Holdings Inc.
8.9.SAFT
8.10.Enersys
8.11.Exide Technologies
8.12.Hitachi
8.13.Duke Energy
8.14.Nippon Chemi-Con Corporation
8.15.Samsung SDI Co. Ltd.
8.16.Alstom
8.17.Kokam
9.360 DEGREE ANALYSTVIEW
10.APPENDIX
10.1.Research Methodology
10.2.References
10.3.Abbreviations
10.4.Disclaimer
10.5.Contact Us
List of Tables
TABLE List of data sources
TABLE Market drivers; Impact Analysis
TABLE Market restraints; Impact Analysis
TABLE Advanced Energy Systems market: Technology Snapshot (2018)
TABLE Segment Dashboard; Definition and Scope, by Technology
TABLE Global Advanced Energy Systems market, by Technology 2014-2025 (USD Million)
TABLE Advanced Energy Systems market: Regional snapshot (2018)
TABLE Segment Dashboard; Definition and Scope, by Region
TABLE Global Advanced Energy Systems market, by Region 2014-2025 (USD Million)
TABLE North America Advanced Energy Systems market, by Country, 2014-2025 (USD Million)
TABLE North America Advanced Energy Systems market, by Technology, 2014-2025 (USD Million)
TABLE Europe Advanced Energy Systems market, by country, 2014-2025 (USD Million)
TABLE Europe Advanced Energy Systems market, by Technology, 2014-2025 (USD Million)
TABLE Asia Pacific Advanced Energy Systems market, by country, 2014-2025 (USD Million)
TABLE Asia Pacific Advanced Energy Systems market, by Technology, 2014-2025 (USD Million)
TABLE Latin America Advanced Energy Systems market, by country, 2014-2025 (USD Million)
TABLE Latin America Advanced Energy Systems market, by Technology, 2014-2025 (USD Million)
TABLE Middle East and Africa Advanced Energy Systems market, by country, 2014-2025 (USD Million)
TABLE Middle East and Africa Advanced Energy Systems market, by Technology, 2014-2025 (USD Million)
List of Figures
FIGURE Advanced Energy Systems market segmentation
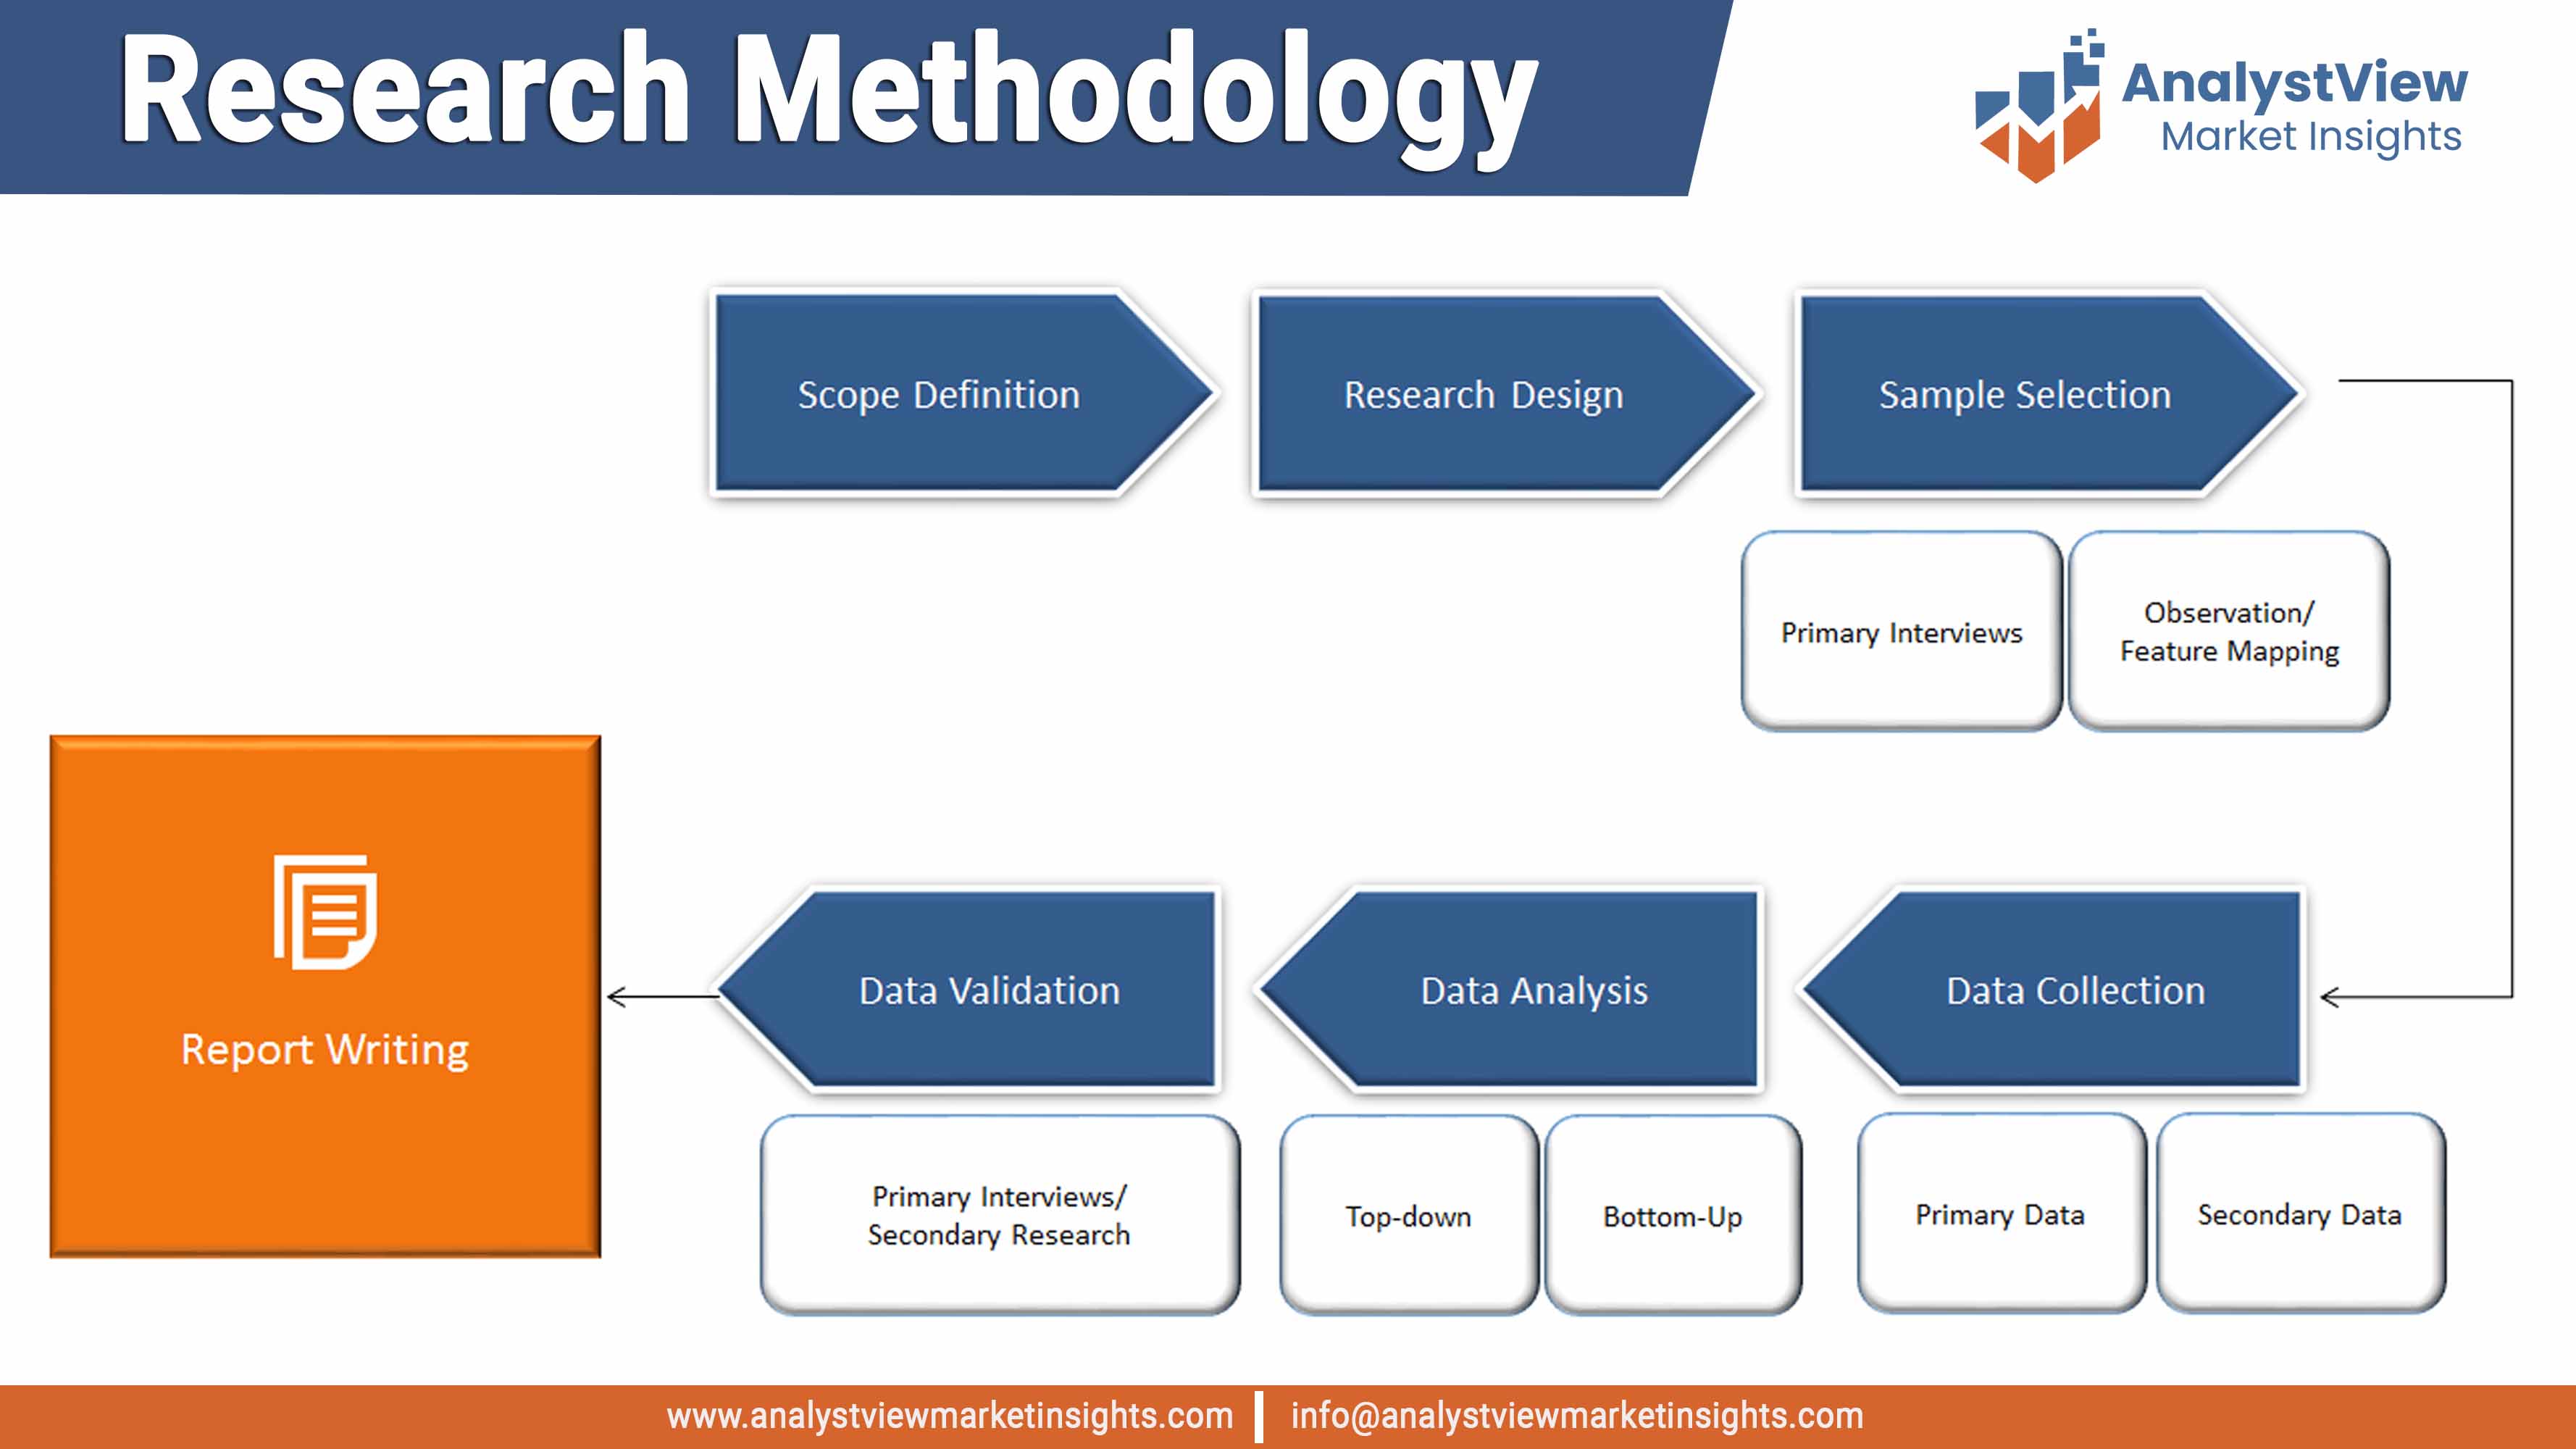
FIGURE Market research methodology
FIGURE Value chain analysis
FIGURE Porter’s Five Forces Analysis
FIGURE Market Attractiveness Analysis
FIGURE Competitive Landscape; Key company market share analysis, 2018
FIGURE Technology segment market share analysis, 2018 & 2025
FIGURE Technology segment market size forecast and trend analysis, 2014 to 2025 (USD Million)
FIGURE Flywheel market size forecast and trend analysis, 2014 to 2025 (USD Million)
FIGURE Batteries market size forecast and trend analysis, 2014 to 2025 (USD Million)
FIGURE Compressed Air market size forecast and trend analysis, 2014 to 2025 (USD Million)
FIGURE Thermal market size forecast and trend analysis, 2014 to 2025 (USD Million)
FIGURE Molten Salt market size forecast and trend analysis, 2014 to 2025 (USD Million)
FIGURE Regional segment market share analysis, 2018 & 2025
FIGURE Regional segment market size forecast and trend analysis, 2014 to 2025 (USD Million)
FIGURE North America Advanced Energy Systems market share and leading players, 2018
FIGURE Europe Advanced Energy Systems market share and leading players, 2018
FIGURE Asia Pacific Advanced Energy Systems market share and leading players, 2018
FIGURE Latin America Advanced Energy Systems market share and leading players, 2018
FIGURE Middle East and Africa Advanced Energy Systems market share and leading players, 2018
FIGURE North America market share analysis by country, 2018
FIGURE U.S. market size, forecast and trend analysis, 2014 to 2025 (USD Million)
FIGURE Canada market size, forecast and trend analysis, 2014 to 2025 (USD Million)
FIGURE Europe market share analysis by country, 2018
FIGURE Germany market size, forecast and trend analysis, 2014 to 2025 (USD Million)
FIGURE Spain market size, forecast and trend analysis, 2014 to 2025 (USD Million)
FIGURE Italy market size, forecast and trend analysis, 2014 to 2025 (USD Million)
FIGURE UK market size, forecast and trend analysis, 2014 to 2025 (USD Million)
FIGURE France market size, forecast and trend analysis, 2014 to 2025 (USD Million)
FIGURE Rest of the Europe market size, forecast and trend analysis, 2014 to 2025 (USD Million)
FIGURE Asia Pacific market share analysis by country, 2018
FIGURE India market size, forecast and trend analysis, 2014 to 2025 (USD Million)
FIGURE China market size, forecast and trend analysis, 2014 to 2025 (USD Million)
FIGURE Japan market size, forecast and trend analysis, 2014 to 2025 (USD Million)
FIGURE South Korea market size, forecast and trend analysis, 2014 to 2025 (USD Million)
FIGURE Singapore market size, forecast and trend analysis, 2014 to 2025 (USD Million)
FIGURE Rest of APAC market size, forecast and trend analysis, 2014 to 2025 (USD Million)
FIGURE Latin America market size, forecast and trend analysis, 2014 to 2025 (USD Million)
FIGURE Latin America market share analysis by country, 2018
FIGURE Brazil market size, forecast and trend analysis, 2014 to 2025 (USD Million)
FIGURE Mexico market size, forecast and trend analysis, 2014 to 2025 (USD Million)
FIGURE Argentina market size, forecast and trend analysis, 2014 to 2025 (USD Million)
FIGURE Rest of LATAM market size, forecast and trend analysis, 2014 to 2025 (USD Million)
FIGURE Middle East and Africa market size, forecast and trend analysis, 2014 to 2025 (USD Million)
FIGURE Middle East and Africa market share analysis by country, 2018
FIGURE Saudi Arabia market size, forecast and trend analysis, 2014 to 2025 (USD Million)
FIGURE United Arab Emirates market size, forecast and trend analysis, 2014 to 2025 (USD Million)
